
USDJPY INTRADAY ANALYSIS
Date:Thursday, 6th August 2015
Read the long term analysis here

The minor wave dip to 120.429 resumed the bullish trend in a fast and typical impulse manner completing the first two waves in a journey which is believed to be a strong 3rd minor wave to break above 126.10 in a bid to reach 135.7 (2002 high)

The chart above shows the minuette and subminuette wave count which shows that price could advance further to 125.8 before an intraday dip.
MONDAY, 10TH AUGUST 2015

To complete this pattern, price is expected to rally but must stay below 125.75 to be considered a valid pattern.
If the pattern completes, a dip is expected to at least 123.
THURSDAY, 13TH AUGUST, 2015

Yes!, just as we forecast, price rallied as expected to complete the last leg of the ending diagonal and dipped from there. I have taken the first 90 pips from this trade after selling at 124.85. I expect the bullish trend to continue after the correction which might end at 123.
We are expecting a zigzag correction to 123 after which price could rally for a very strong bullish move.
FRIDAY, 14TH AUGUST, 2015

Price is expected to continue the dip which should break below 123.722 and trade in the region of 123 before the favoured larger degree bullish move continues.
Price should be contained below 124.678 for a hope of further intra day dip
TUESDAY, 18TH JULY, 2015

Price, still reacting to the leading diagonal after the first break out, is now congesting in what looks like a triangle formation. Price is expected to remain below 124.6 for any chance for further bearish correction. A break below the b-d triangle line will confirm further sell off to 123.
The longer term is still bullish but the downside correction is not over until at least 124.6 is broken upside.
THURSDAY, 20TH AUGUST, 2015

Price has broken out of the congestion in what we expect to be a zigzag correction. Price is presently testing 123.74 support. A break below the support will mean that price will have no barrier to 123, which is our immediate target for the correction. We still favour the long term bullish move to continue
TUESDAY, 25TH AUGUST, 2015
Our target at 123 was breached powerfully suggesting that the bearish reversal has started.
Price is expected to pull back after the bearish outbreak, to 120.40-80 before the bearish journey continues

THURSDAY, 27TH AUGUST, 2015
After such a powerful break out from the diagonal, price could have started the long term bearish trend.
As price trades below 120.50 in what may be a triangle 4th wave as shown in the chart below.
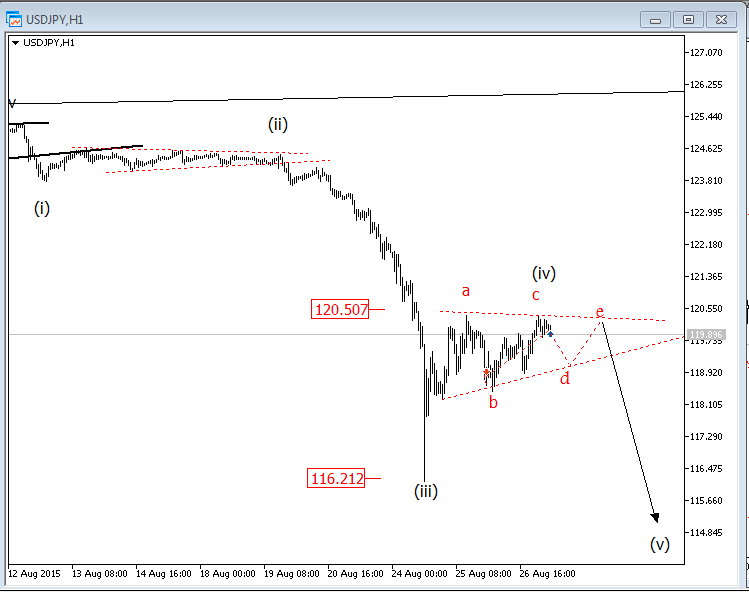
Price should hold below 120.5 till the triangle is completed after which a break down the b-d line would mean the 5th wave is on the way to 115.
This is an opportunity to sell if one can be patient.
FRIDAY, 28TH AUGUST, 2015
The projected corrective pattern was not completed yesterday as price rallied further to 121.4. We are still expecting a complete corrective pattern that will suit the 4th wave.
Price presently has completed a double zigzag corrective pattern as shown by the chart below.

A break below 120.48 will be a good set up for a short trade as price will be expected to dip below 116.

No comments:
Post a Comment