Thursday, April 7, 2016

This Pattern Could Drive Gold Down

On 21st December 2015, we posted an analysis on Gold. We noted the end of an impulse wave from1920.50. The 5th wave of the impulse being an ending diagonal.

Price rallied fast in the early months of 2016 just as expected. You can read the analysis here.

The break out of the diagonal was fast and an impulse wave. Price was short of 1300.46 ( our final immediate target) and started declining, signifying the end of the well-formed bullish impulse wave.

After such an impulse wave, a 3-wave correction (decline in this case) is a no-brainer according to Elliott wave theory.

The emerging corrective pattern is our duty to figure out.

In the chart below, there is a good likelihood that the corrective pattern could be a double zigzag which could be as deep as 1170.70-1146.08 levels ( good confluence zone ).


The 'X' wave of the probable zigzag could be a triangle pattern.

The chart below shows the triangle in a lower time frame.


If price completes the last two legs of the triangle as shown and held below 1242 price level, it has a good chance of declining to 1170.70-1146.08.

This analysis is a forecast and will require price to commit to it before we commit ourselves to considering its bearish outcome.

Let's alert you of the completion and any alternatives.


Subscribe to our mailing list

* indicates required

Wednesday, April 6, 2016

Ending Diagonal In Gbpcad; What next?

On 1st April, we posted an analysis using the chart below.


You can read the full analysis here .

Price seem to have completed the pattern we forecast. the 4th and 5th legs of the diagonal seems to have completed from the chart below.

At the completion of a diagonal, price often moves in high momentum in the opposite direction.


The diagonal can be seen clearly in the chart below.


Price will be expected to rise from here and 1.9070 is the ultimate target.

Let's alert you of trading opportunities that arise from Elliott wave patterns completion.


Subscribe to our mailing list

* indicates required

Intra- Day Analysis: Gbpusd at a brink

Yesterday, 5th April, we did a comprehensive analysis of the cable from the long term to intra day price actions. You can read the article here

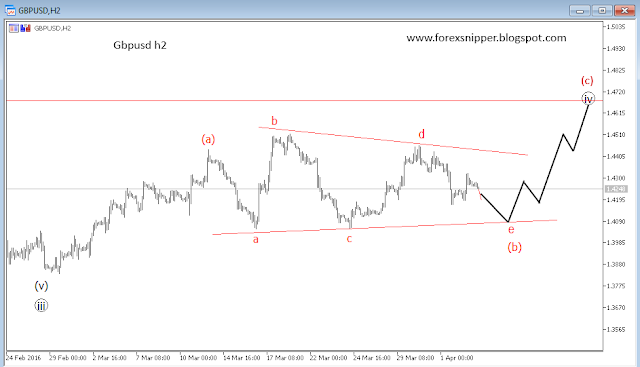
From the medium term view, we were expecting the completion of a triangle (b) before a renewed bullish move.

The triangle was expected to be contained above 1.4080 ( now adjusted to 1.4050).

Price dipped as expected and we are now taking a closer look at the intra day Elliott wave counts.

The chart below shows that the last leg (e) of the triangle is about to be completed with a zigzag pattern with an obvious impulsive last leg.


We will expect the intra day price of the cable to dip further to 1.4080- 1.4050 level. We don't expect price to bridge this level for this analysis to be valid.

A break above 1.4172 could trigger an intra day bullish move and we may see price advancing to 1.4650, the projected level for the long term correction to complete ( as explained in the previous article)

We can alert you when this pattern is complete. Subscribe below.


Subscribe to our mailing list

* indicates required

Tuesday, April 5, 2016

Ending Diagonal In Caterpillar Inc...

Caterpillar Inc has lost more than $2 stock price since yesterday and could still lose more.
Price amidst what are commonly referred to as "economic and financial uncertainties" is responding ton Elliott wave terminating pattern- the ending diagonal.

A long term bullish impulse move which started in August 2014 terminated at 56.25 price level and a probable impulse wave upside followed immediately. The impulse wave being the first leg of a probable correction.

The impulse wave upside has completed its 3rd wave with an ending diagonal that the market is now responding to. Ending diagonals are often followed by fast movement in the opposite direction.


The price of this stock is expected to dip further to $70.5 losing more $5 or more in coming days before the rally continues.

The ending diagonal is shown in the 15min chart below.


A dip to $70.5 is highly likely.

Do you follow prices of stock markets, Etfs, Stock Indexes, Currencies, and Commodities. We can provide you will regular Elliott wave analysis of your selected instruments and alert you when an Elliott wave tradable pattern is complete.
Please subscribe to our mailing list and send a personal mail to Forexmaster05@yahoo.com with the list of your preferred instrument.


Subscribe to our mailing list

* indicates required

CABLE: Elliott Wave Interpretation

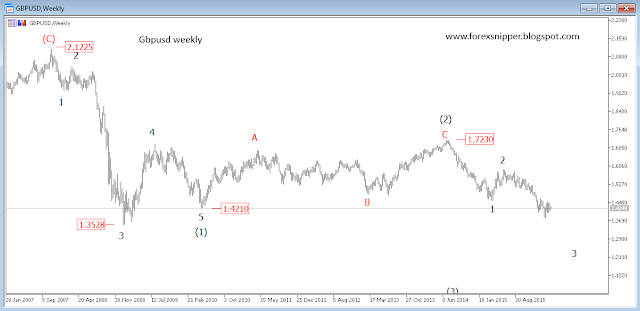
The bearishness of the cable started late 2007 after a long term bullish correction that ended at 2.1225. It wasn't unexpected - a trend often continues after a correction and Elliott wave theory among many other things, helps to distinguish between a trend and a correction.


Price dipped from 2.1225 to 1.4210 in an impulse wave with a truncated sub-wave 5. We saw a zigzag correction afterward to 1.7230 though shallow.

The continued dip from 1.7230 is meant to be a wave (3) and if for no other reason, the sub-wave 1 of (3) is strong.

The strength of the dollar to pound is expected to continue in a move that could make a pound sterling go for less than a dollar.

Presently, the sub-wave 3 of the 3rd wave is still in motion.

The chart below shows that this sub-wave 3 is maybe correcting for the last time before it completes its phase a long way below 1.3831.


The question now is- "do we have a corrective pattern to show that its 4th wave has concluded?".

More often than not, wave 4 corrects to the 4th sub-wave of  wave 3 of the same degree. So there is a possibility of the cable rallying to 1.4669 and its neighborhood before it completes its phase downward.

The chart below also shows a possible emerging pattern ( a zigzag pattern with a triangle as the second leg) to support a probable short term rally to 1. 4669 (after the completion of the triangle) before the long term dip continues.


Intraday Expectation: The 15m chart below shows that the last leg of the triangle wave e could be a double zigzag pattern and is expected to end above 1.4080.


We will wait for price to get to this level and see what happens from there.

Subscribe to our mailing list to alert you early.


Subscribe to our mailing list

* indicates required

Monday, April 4, 2016

Silver: How Far Can It Go Down Before Turning Up?

The long term bearish move we saw in Gold and Silver ended towards the end of 2015 in a terminating ending diagonal pattern.

The dip was a clear impulse wave.

The diagonal structure ended at 13.59 and price broke upside just as expected.

The rally from 13.59 to 16.10 (mid-march 2016) is an impulse 1st wave of the first leg of whatever corrective that might emerge in months time.

Price, presently, is in a 3-wave dip from 16.10 which could be taken as the second wave.

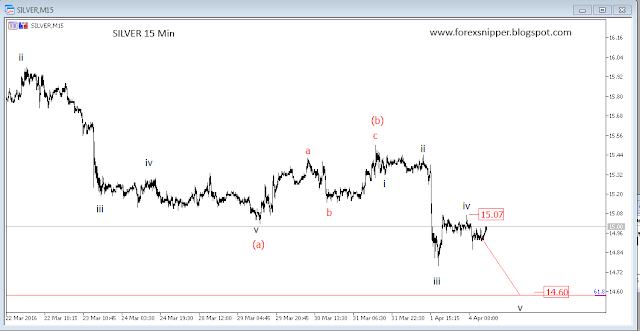
From different projected level, 14.40-1460 is expected to support price if it gets there in a bid to complete the zigzag pattern (2nd wave).


We would be expecting price to rally from this zone (14.40-60) for the start of a probable stronger rally that could break 16.10.

Intraday View:  We expect price to dip further to 14.40-60 especially if 15.07 ( an intra day resistance) is held


Subscribe to our mailing list

* indicates required

AudUsd Analysis: Long Term to Intra day

From 1.1097 in may 2011 to 0.6817, according to the weekly chart below price dipped in a typical impulse wave. According to the wave theory, price usually rallies in a 3-wave correction after a motive (impulse) wave. So Audusd may have bottomed at 0.6817.


The sub-wave rally that followed after the dip, is a clear impulse wave which may later be a sub-phase of the larger term corrective phase.
Price is expected to rally to 0.8880 in the long term.

Short Term View:


The rally from 0.6817 is a clear impulse wave, a corrective dip could follow to probably 0.7276 (50% fibo retracement) before the long term bullish correction resumes.

Intra Day View


The 1hr chart above shows that price is trying to break below wave(iv) of the 5th subwave. This could trigger an intra day bearish move to 0.7460 and below.

Subscribe to our mailing list

* indicates required

Friday, April 1, 2016

Ahead of the NFP: Why we expect Usdcad to rally

Price after the long term bullish cycle which ended at 1.4701 showed the first sign that the bearish correction will take over.

There is an indication that after such a cycle, a motive wave should follow especially if there will be a zigzag correction.

Price, from 1.4701, dipped in a clear impulse wave which may now have ended at 1.2859 as shown in the hourly chart below.


The intraday chart below also shows the 5th sub-wave of the 'said' impulse wave is a clear impulse wave of its own.


Price has now rallied above the 4th micro-wave of this 5th sub-wave.
We expect the rally to continue to 1.3298 and if deeper, could go to 1.3540.

Subscribe to our mailing list to receive high probability forecasts.


Subscribe to our mailing list

* indicates required

Intraday Analysis: Gbpcad Could Rally a bit

The recent dip in the hourly chart is forming a clear impulse wave and we want to believe that the 3rd wave is about to end.

The 5th sub-wave of the 3rd wave could be an ending diagonal as indicated in the chart below.


If the emerging diagonal completes as indicated, price could rally to at least 1.9190 before we see further dip to complete the short term impulse downtrend.


Subscribe to our mailing list

* indicates required

Related Posts Plugin for WordPress, Blogger...