Saturday, October 29, 2016

Our Result this week: Forex, Commodities and Intra_day Forex Signals

Our telegram channels were interesting this week as we shared our forecasts and signals with followers.

We have three functional channels.

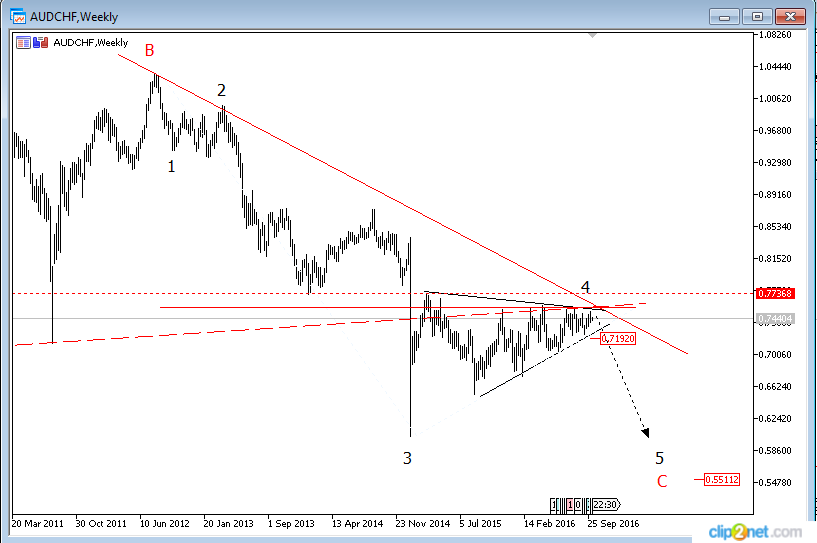
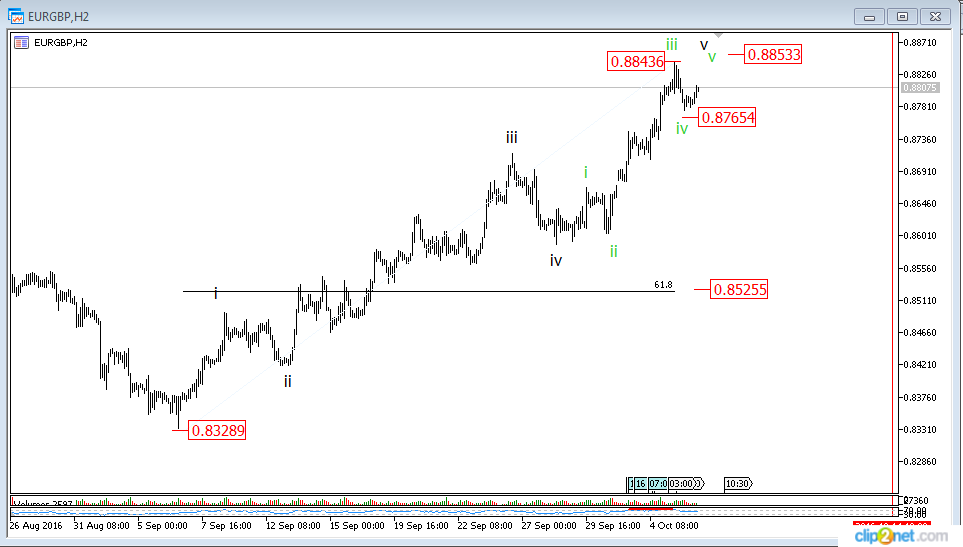
1. Swing Elliott wave forecasts on the currency market (FOREX). Join Here

On this channel, we analyse some selected currency pairs and give exact forecasts with entry methods, exit levels and targets to look forward to. The entry time frame is usually 1 hr or 2 hr.

2. Swing Elliott wave forecast on Commodities. Join Here

On this channel, we analyse some selected commodities and give exact forecasts with entry methods, exit levels and targets to look forward to. The entry time frame is usually 1 hr or 2 hr.

We also follow up our forecasts with regular updates on stop loss adjustment, alternative forecast and keep our followers abreast with useful technical information that can help them make and keep profits.

Below is the result of this week's forecast on Forex and Commodities.


3. Intra-day Forex Signals Channel. Join Here


On this channel which started this week, we promised to generate a net 500-1000 pips in just one month.
No forecasts, no charts, no software. Just trade entries, stop loss and three target levels.

Though the result this week is average but we will still stay focus to our plan and you can also be part of it free for the next 3 weeks.
Note that the signals generated here are not based on Elliott Wave Theory

Here is our result this week.

 We will continue this week and you can also be a part of  it.


We have included Forecast channels on Stock Indexes and Equities which will commence next week.


If you trade this investment vehicles, you can follow our Telegram Channels below to get high probability forecasts.


Join Stock Index Channel


Join Equities Channel


Sunday, October 23, 2016

Currency and Commodities Watch_List


Review of our activities last week on telegram Channel and what we expect this week from our Watch list of Currency pairs and Commodities.


Join our Currency Channel
Join our Commodities Channel and Also

Enjoy free 1 month Intra-day trade alerts on our Intraday_Forex_Alert Channel.

Friday, October 21, 2016

Need 500-1000 Pips Monthly? Try this FREE for 1 Month.


We are offering you 1 MONTH FREE FOREX SIGNALS that GUARANTEES 500 to 1000 PIPS per month.

Instruments covered : All major currency pairs involving Eur, Gbp, Usd Jpy, Cad, Chf, Nzd and Aud.
Number of trades per month: 20-40 trades

Expected Net Pips: +500 to +1500 pips

Stop Loss Range: 20 to 80 Pips depending on the volatility of the pair we are looking at.

Targets: Three levels of target. 

Target 1: 1:1 R/R ( 70-90% winning ratio)
Target 2: 1:2 R/R ( 60% winning ratio)
Target 3: 1:3 R/R ( 25-40% winning ratio)
Specific Time of Signal: No specific time. Signals can be sent anytime

Mode of delivery: 

1. Whatsapp (Send request to +2348134820569)
2. Sms. Send request to +2348134820569 ( This will attract a token of $10)
3. Telegram Channel
https://telegram.me/joinchat/DRzSi0AtB9ZxLRLzgZ_Qww .


Other information about our service

1. The signal follows the trend
2. No charts, no analysis
3. No Robots, no software
4. Specific entries, exits and targets.
5. Simple to use. You can open positions on your phone, tablets or PC.

Note that this is a TRIAL period. One month is enough for you to make decision to subscribe to our premium signal. You can try this on your DEMO account.

Starting date: 24th October, 2016
Ending date: 18th November, 2016

Monday, October 17, 2016

My Watch List for the Week

Most currency pairs closed powerfully last week thereby defining their immediate trend. I discussed 8 currency pairs in the video below. Updates will come later in the week.


You can join my telegram channel for quick updates

Thursday, October 13, 2016

Audnzd, Imminent bearish move?

In the last update on this currency pair, we identified an impulse wave and projected a bearish move to 1.03- 1.04.

Price rallied above our identified top as the 5th wave became extended.

This is one of the patterns where we see double extensions within an impulse wave.


The extended 5th wave may have completed just below major resistance level (in yellow) and price may now start a bearish corrective move that could go as far as 1.04275.

We identified this pattern before the London market was opened today and shared with members of our Telegram Channel with trade recommendation.

You can also be part of our Telegram Channel and get uninterrupted updates when we identify the completion of a pattern.


Wednesday, October 12, 2016

Nzdusd--- In Technical Analysis,Nothing is sure and Everything is probable

Many times, technical traders believe that one trade set-up is better than another. We won't realise this error until we ask ourselves these simple questions- "do I stake more of my capital on this trade than the other?" or "Do I exit this trade?. I have a better or another set-up somewhere and it's kind of contradictory".

Technical analysis may give us an edge but one thing is consistent-you will never know which trade set-up will win ,lose, drive a large move or a small one. We can only know when the move is done.

It is important that every technical trade set-up should be given equal importance especially when gotten from a similar time frame.


The chart above was the one we used on  23rd September after price broke out of a double zigzag wave (ii), so we had the first selling opportunity with stop loss above the terminus of wave (ii).

Price moved downside as expected for wave (iii). Price rallied and the thought of  "EXIT"would have dominated. Rather we recognised the wave ii of (iii) lining below a falling trend-line and we posted an update.


The chart above was used in the later update on 27th September where we expected price to stay below 0.733 and break below 0.72198 en route to 0.7082 which was considered the minimum ultimate target posing more than 1:2 R/R  for the first entry and 1:4 for the second target.

This is a type of opportunity that helps recover series of loses or cover good ground and help make buoyant to take more trades with confidence.

The question is 'would we allow the trade to run?'

Presently, this is what we have


Now that price has already surpassed 0.7080, the next target to look out for is 0.6960.

Usdcad In a Leading Diagonal

Price completed a leading diagonal on the hourly chart and almost immediately broke out of it powerfully- a typical indication of how price reacts to diagonals.

We expect price to go lower after the rally we had through out yesterday to the region of the diagonal.
The fast move downside could continue.

This is how I intend taking the position.


I also shared this on our Telegram Channel. You may join HERE


Monday, October 10, 2016

Audchf: Long term Triangle; watch out for breakout.


Below is the weekly chart of  of Audchf with an good probability of more bearish move.


Price has gone down in 3-waves as part of a correction which has lasted for decades. The renewed bearish move started mid-2012 in what could be a very good impulse wave with the 4th wave a corrective triangle. A break below this triangle or below 0.7192 may result in more bearish move to 0.5 or below.

This will, of course, take years to accomplish. A good watch for position traders.

There will be short term trading opportunities along the way if price can break out of the triangle confinement to resume the bearish trend .

Most times, THE TREND CAN BE YOUR FRIEND.

Join us on Telegram


Gold After The Bearish Break-out.

On 27th September, we were so firm on a bearish bias on Gold that all our forecast were pointing downside.
Two scenario we discussed in the last update on Gold gave us so much clue that price would more likely go downside than not.

In fact, for months, we have been talking bearish all the way.

Follow all our recent Gold updates


Price fell from the moment and later crashed to break out of the confinement.

We expect price to go as low as 1199 and maybe deeper.

Let's continue from the last updates.

Scenario 1.


Form 1375 where the bullish impulse move peaked, one would have expected a correction- which in this case is a zigzag with a triangle "(b)". The break out of this triangle is expected to be a motive wave . We expect price to correct upside to around 1302.5 (a retest of the break-out level) before the bearish move continues even stronger.

What IF the correction is not as deep as discussed and instead price goes sideway , we have another scenario to watch out for.


The "(b)" leg of the correction in this case is a flat pattern and price may have completed the first 3-legs of the resulting impulse wave. The corrective/consolidating rally could end at 1280 price region for an extended bearish move to 1199.

Price , of course, may decide to move in any other way; but we have clues and wait fro price to validate or invalidate.

The truth is- when price does validate, the effect is often profitable.

More updates to come later.

Join us on Telegram

Thursday, October 6, 2016

CadJpy At 78.5!. What next?

In the last updates, we forecast a corrective rally for Cadjpy to 78.5 after a bearish impulse move. We even gave a trade recommendation to buy to 78.5 prior to the Oil producers' meeting in Algiers.

Price rallied to 78.5 and we think a bearish move may re-surface.


The chart above shows that the correction is a zigzag pattern which may complete just beneath the falling trendline.

If price is well resisted  below 78.9 and falls below the rising trendline78.5, we may have a strong reason to short cadJpy for the continued bearish move.

If price pierce the falling trendline powerfully, we may see more upside move.

Follow our Telegram channel to get fast updates.

The Bulls aren't done with Usdcad.


The bears ushered the Loonie into the beginning of the year in a rather fast typical five non-overlapping waves which we call Impulse wave.

The bearish impulse wave continued till May and ended at 1.2456 and ever since, has been engaging in a time-consuming corrective move upside. We have taken trades at some clear points in the correction and have maintained that the move still remain upside. Price has been validating our point of view along the way.

1.35 is the projected level for the correction to end, of course, this is probable; but believe that we are not doing any guess work.

The corrective pattern seems to be a double zigzag pattern. The 1st leg being a zigzag, 2nd -a triangle and the 3rd is looking like a zigzag as well. What is so interesting is the pattern symmetry is price moves just as we forecast.

The symmetrical part is that the 2nd wave of the 3rd leg of the double zigzag looks like a triangle as well and YES! that's what we want to take advantage of.


I hope you get the point with chart above. A triangle has completed the first 4 legs. If the last leg of the triangle completes as shown above and price shows a sign of further bullish move, we may see a renewed move to 1.35 and THAT we don't want to miss. It will mean that we are trading in the direction of the immediate intra-day trend.

This, surely, is not cast on IRON as price may go in many other ways. BUT we have created our edge and we just need price to approve before we take the next step.

Follow our updates and get free trade recommendations on TELEGRAM

Eurgbp: An Imminent correction to 0.8525?


Do you think we have a 5-wave impulsive rally here? The 5th leg of the rally could complete its 5th sub-wave at 0.8853 or form a double top with 0.8843.

According to the wave theory, a 3-wave decline usually follows a rally like this.

If price moves as expected and breaks below 0.8765, price may correct to 0.8525 and we don't want to miss this.

Follow us on our Telegram channel for updates and free trade signals.

Audnzd : Bearish correction to 1.03- 1.04?


Price bottomed at 1.02267 after a long term motive wave downside.

The long term correction started from 1.02267 with a well-formed impulsive 5-wave swings.

A correction is expected to 1.03873 before the long term corrective rally will be expected to continue.

Trade Recommendation:

SELL AUDNZD around 1.0575.

Stop Loss at 1.0640

Targets : 1.05 and 1.04

We advice to aim 1:2 R/R and maintain proper management (not more than 3% of total fund should be risked)


Note: It's not sure that this trade will win or lose. The signal provider will not be responsible for any trade win or loss. Traders who take this position do so at their own risk

For more free signals, join us on Telegram channel.


Related Posts Plugin for WordPress, Blogger...