Wednesday, July 30, 2014
How to Join the Usdcad Bull Party!
For partnership, fund management and mentorship, you can contact me
Tuesday, July 29, 2014
Eurusd Short and Long term Analysis
Hi folks, it's been long I haven't posted here. I am sorry for not have been around. Of course a lot of things have happened. Recently deepened myself into some studies. I just love my charts- like my wife .
Well, here is my analysis on the most popular pair-Eurusd
Taking into account the H4 elliot wave analysis on the bearish move from 1.3700, wave 3 is about to be completed after completing a 5-wave elliot swings and resting on a diagonal support, a push to 1.35100 resistance is thinkable and highly probable in order to give us a wave 4, from where we can sell again for large profits.
On the daily chart, 1.3510 was bridged convincingly and a retest is possible for a further push down to 1.3300 ( A support) and 1.3100 ( convergence of nearly 1.618% extension of wave 1 from 2 and a level of support).
I expect Eurusd to retrace and them push down. I am still strongly bearish but I am going to take a bull short aiming 1.3510 or lower
The analytical charts below on H4 and D1 will give you a clearer picture.
NB: This analysis is risky and care should be taken in interpretation. You can drop your comment or mail me if you have any question . Please this is for educational purpose and should not be taken as a call for trade.E-mail-sanmiadeagbo@yahoo.com
Facebook- sanmi Adeagbo twitter- Forexelyte
Phone no: (234)08134820569Please let me know if this blog has been helping someone by your comments and you can also contact me if you need a trading partner,mentor or fund manager
Monday, July 7, 2014
Why Selling GbpChf is not a bad Idea.
This bearish run on this pair is imminent and it's just a matter of time. With mouth-watering patterns forming, potential pips are to be made shortly with the weekly, daily and 4hourly charts embracing the bears.
On the weekly chart, a successful BAT has just been concluded just at the roof of a strong resistance trendline.
On the daily, a bearish BUTTERFLY is completed with an engulfing bearish candlestick pattern forming.
The terminal zone ( 1.5280-1.5380) is a very strong price reversal zone.
In the analytical chart shown below, I analysed with the D1 chart only in order to see a PICTURE ( how a BAT is pregnant of a BUTTERFLY) and all these are happening at the roof of a channel. Thinking bearish in this case isn't bad at all.
Going by the 4 Hour chart, an end of wave 5 Wave-pattern has been successful at the same resistance level afformentioned. and unsurprisingly, 4H has responded to the bears in its own way waiting for the big boys to join the move to provide an explosive run before the bulls will wake up, if they wake at all.
With all these, I see price coming to 1.5185 ( short term), 1.500,1.4920 and 1.4816 before the bullish would gather momentum to counter the move. If the rising pink trendline on D1 is broken down-side, price could be broken loose to 1.4150 and below. It's just a matter of time.
NB: This analysis is long term and care should be taken in interpretation. You can drop your comment or mail me if you have any question . Please this is for educational purpose and should not be taken as a call for trade.
Please let me know if this blog has been helping someone by your comments and you can also contact me if you need a trading partner,mentor or fund manager
E-mail-sanmiadeagbo@yahoo.comFacebook- sanmi Adeagbotwitter- ForexelytePhone no: (234)08134820569
Sunday, July 6, 2014
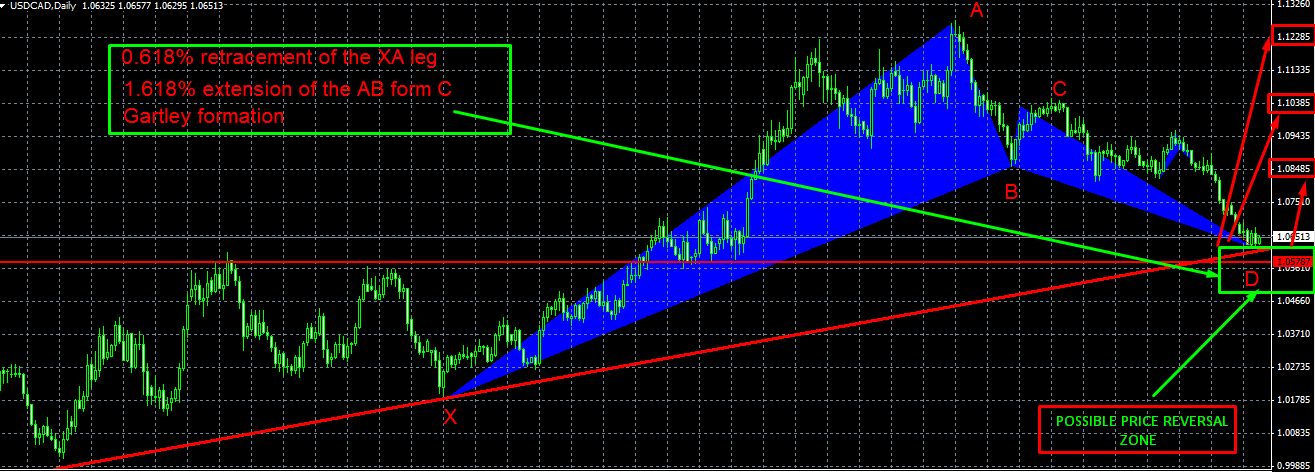
Why I bought Usdcad
Let me start from the bigger picture- the weekly chart. This pair is setting to form a potential 61.8% gartley pattern at 1.170 and its neighbourhood and wave analysis in support of this potential makes this thought stronger.
Going by the wave count which started July 2011; wave 3 has
successfully completed at 1.1266 and price retraced to the present level ( a
potential wave 4) and I am expecting price to push up from here or anytime soon
and break the wave 3 to form a wave 5.
1.1700 is a very strong price magnetic zone due to the
convergence of Fibonacci extensions and retracement (check the weekly analytical chart below) and a Resistance .
Wave 5 could potentially end there.
How are we sure, to a certain degree, that wave 4 will be
formed there. This can be answered by zooming down to the daily time frame.
Now, to the daily time frame. Price has successfully completed
a gartley pattern (check the daily analytical chart below) and I expect a big
move up.
I started buying on 3rd of this month and I’m
still holding on with stop loss at 1.0560 and targets at 1.0800 and 1.0950 for
the time being. I expect price to break 1.1280 to form a new high at 1.170 or
thereabout .
On the other hand If price go down to break 1.0500 with high
momentum, this analysis is invalid and I might have to look again.
NB: This analysis is long term and care should be taken in interpretation. You can drop your comment or mail me if you have any question . Please this is for educational purpose and should not be taken as a call for trade.
Please let me know if this blog has been helping someone by your comments and you can also contact me if you need a trading partner,mentor or fund manager
E-mail-sanmiadeagbo@yahoo.com
Facebook- sanmi Adeagbo
twitter- Forexelyte
Phone no: (234)08134820569
Subscribe to:
Posts (Atom)


