The weekly chart above shows the sell off from 252.167 to 118.161 in a supercycle bearish impulsive journey. After such an impulse wave, a correction would be expected. The correction started from 118.161 in a zigzag pattern.
The last leg of the zigzag (an impulsive cycle wave from 116.325) is close to termination (presently at a very strong resistive zone) and the long term bearish trend will be expected to resume.
All focus now on the terminus pattern of the 5th wave of this cycle impulse wave.
The daily chart above shows that the terminus pattern is an ending diagonal with a wide base contrasting to a thin mouth. When the expected sell off starts, it's going to be of high momentum.
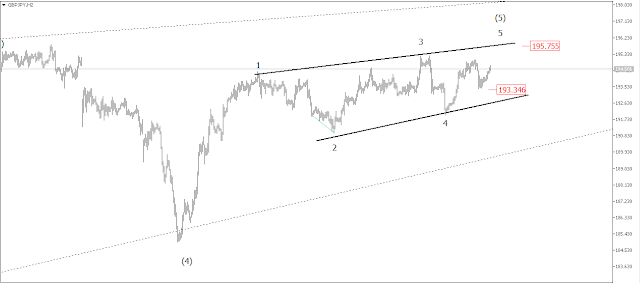
The 5th of this diagonal might not get to the terminus of the 3rd wave at 197 and price could rally a bit to 195.75 before a fast fall as the hourly chart below shows.
The hourly chart above shows that the 5th wave of the ending diagonal could be an ending diagonal which further gives confidence for a bearish outlook.
If price is contained below 195.755 and breaks 193.34, price could start a big fall to 190.863 (in the short term) and 173.553 as the final 'after-diagonal' price reaction target.


No comments:
Post a Comment