

The weekly chart above shows the activities of price from 0.6908 to 0.9675 and back to 0.8111. Price is in a long term bullish move. The rally is corrective and is projected to continue to 1.0861. Quite long...huh?
The projected corrective pattern is a double zigzag .
The recent dip in the 4hr chart below is a double zigzag correction which is projected to end at 0.8895-0.8750 before the rally continues.

If price advances and breaks above 0.899, there will be a good buying opportunity.
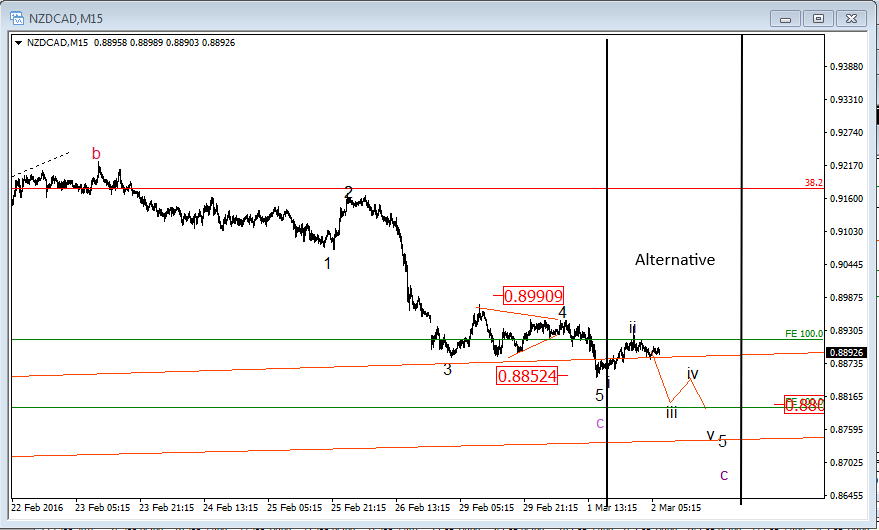
Price can alternatively, as shown in the 15min chart below, dip further to 0.88 regions and it will be good to look for buying signals
You can watch the video of this analysis below
Have you subscribed to my newsletter?. Sign up at the right top corner to get market analysis and signals sent directly to your E-mail.

No comments:
Post a Comment