
Below is the weekly chart of of Audchf with an good probability of more bearish move.
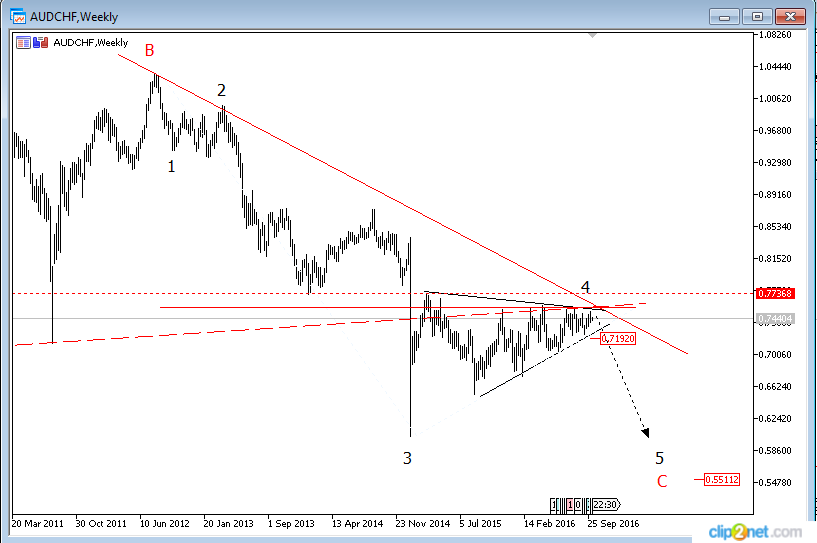
Price has gone down in 3-waves as part of a correction which has lasted for decades. The renewed bearish move started mid-2012 in what could be a very good impulse wave with the 4th wave a corrective triangle. A break below this triangle or below 0.7192 may result in more bearish move to 0.5 or below.
This will, of course, take years to accomplish. A good watch for position traders.
There will be short term trading opportunities along the way if price can break out of the triangle confinement to resume the bearish trend .
Most times, THE TREND CAN BE YOUR FRIEND.
Join us on Telegram

No comments:
Post a Comment