Tuesday, October 14, 2014

How to Find Trading Opportunities in ANY Market: Fibonacci Analysis
In this article, Elliott Wave International's Jeffrey Kennedy demonstrates ways to spot trading opportunities across any market and timeframe.

By Elliott Wave International

Elliott Wave International's Senior Analyst Jeffrey Kennedy is the editor of our Elliott Wave Trader's Classroom and one of our most popular instructors. Jeffrey's primary analytical method is the Elliott Wave Principle, but he also uses several other technical tools to supplement his analysis.

You can apply these methods across any market and any time frame.

Learn how you can get a free 14-page Fibonacci eBook at the end of this lesson.


The primary Fibonacci ratios that I use in identifying wave retracements are .236, .382, .500, .618 and .786. Some of you might say that .500 and .786 are not Fibonacci ratios; well, it's all in the math. If you divide the second month of Leonardo's rabbit example by the third month, the answer is .500, 1 divided by 2; .786 is simply the square root of .618.

There are many different Fibonacci ratios used to determine retracement levels. The most common are .382 and .618.

The accompanying charts also demonstrate the relevance of .236, .382, .500 .618 and .786. It's worth noting that Fibonacci retracements can be used on any time frame to identify potential reversal points. An important aspect to remember is that a Fibonacci retracement of a previous wave on a weekly chart is more significant than what you would find on a 60-minute chart.

With five chances, there are not many things I couldn't accomplish. Likewise, with five retracement levels, there won't be many pullbacks that I'll miss. So how do you use Fibonacci retracements in the real world, when you're trading? Do you buy or sell a .382 retracement or wait for a test of the .618 level, only to realize that prices reversed at the .500 level?

The Elliott Wave Principle provides us with a framework that allows us to focus on certain levels at certain times. For example, the most common retracements for waves two, B and X are .500 or .618 of the previous wave. Wave four typically ends at or near a .382 retracement of the prior third wave that it is correcting.

In addition to the above guidelines, I have come up with a few of my own over the past 10 years.

The first is that the best third waves originate from deep second waves. In the wave two position, I like to see a test of the .618 retracement of wave one or even .786. Chances are that a shallower wave two is actually a B or an X wave. In the fourth-wave position, I find the most common Fibonacci retracements to be .382 or .500. On occasion, you will see wave four retrace .618 of wave three. However, when this occurs, it is often sharp and quickly reversed.

My rule of thumb for fourth waves is that whatever is done in price, won't be done in time. What I mean by this is that if wave four is time-consuming, the relevant Fibonacci retracement is usually shallow, .236 or .382. For example, in a contracting triangle where prices seem to chop around forever, wave e of the pattern will end at or near a .236 or .382 retracement of wave three. When wave four is proportional in time to the first three waves, I find the .500 retracement significant. A fourth wave that consumes less time than wave two will often test the .618 retracement of wave three and suggests that more players are entering the market, as evidenced by the price volatility. And finally, in a fast market, like a "third of a third wave," you'll find that retracements are shallow, .236 or .382.

In closing, there are two things I would like to mention. First, in each of the accompanying examples, you'll notice that retracement levels repeat. Within the decline from the high in July Sugar (first chart), each countertrend move was a .618 retracement of the previous wave. The second chart demonstrates the same tendency with the .786 retracement. This event is common and is caused by the fractal nature of the markets.

Second, Fibonacci retracements identify high probability targets for the termination of a wave; they do not represent an absolute must-hold level. So when using Fibonacci retracements, don't be surprised to see prices reverse a few ticks above or below a Fibonacci target. This occurs because other traders are viewing the same levels and trade accordingly. Fibonacci retracements help to focus your attention on a specific price level at a specific time; how prices react at that point determines the significance of the level.


Learn How You Can Use Fibonacci to Improve Your Trading

If you'd like to learn more about Fibonacci and how to apply it to your trading strategy, download the free 14-page eBook, How You Can Use Fibonacci to Improve Your Trading.

EWI Senior Tutorial Instructor Wayne Gorman explains:

  • The Golden Spiral, the Golden Ratio, and the Golden Section
  • How to use Fibonacci ratios/multiples in forecasting
  • How to identify targets and turning points in the markets you trade
  • And more!

See how easy it is to use Fibonacci in your trading. Download your free eBook today >>

This article was syndicated by Elliott Wave International and was originally published under the headline How to Find Trading Opportunities in ANY Market: Fibonacci Analysis. EWI is the world's largest market forecasting firm. Its staff of full-time analysts led by Chartered Market Technician Robert Prechter provides 24-hour-a-day market analysis to institutional and private investors around the world.

Gbpchf Update.


12th October, I forecast a bullish move of this pair ( Read the full gist)

I expected price to break above the wave 4 channel before putting a long postion. 

Despite the triple pin bars on the daily, Gbpchf dipped further and penetrated the support zone I highlighted. My entry level wasn't satisfied, so i stayed out and watched the fast dip.


I still keep my bullish bias intact and I expect price to price to react at 61.8% and 78.6% correction of the previous bullish trend.


Presently, price is returning to the corrective channel after a brief sharp movement below it and it's resting on a very strong intra day support zone. The correction has now dipped to 61.8% retracement, a good reversal fib-ratio.


I will put a long order if price rallies above the support zone to form a nice swing low especilally with a bullish engulfing candle. If this is formed, we would see a nice pin bar on the daily chart.


If price continues the dip, I will watch for reaction at 78.6-88.9 % ( here, price will complete a bat harmonic pattern).


Always check regularly for an update or forward your E-mail to forexmaster05@yahoo.com to alert you of new posts.

Sunday, October 12, 2014

Bullish move continuation on Gbpchf

On 2nd October, I pointed to an ending diagonal which signaled a bearish correction  and I was not surprised that price moved just as anticipated. 

I also pointed to the fact that I have a bullish bias. I expect price, after the completion of the present zigzag correction, to rally and break the top of the ending diagonal to complete the impulsive move.


This projected bullish move is also made tradable by  a three daily pin bar drives resting on the near term support zone, the stochastic momentum on D1 and a divergence on the H4 chart.


When we have a clear recognizable pattern with other technical parameters aligned, we can trade with more confidence.

I will expect price to break above the falling wave 4 channel on H4 before buying.

Conversely, if price breaks below the support zone mentioned in high momentum, new analysis has to be done to be sure of what price is playing out


Let me add you to my mailing list.
Mail me @ forexmaster05@yahoo.com
Whatsapp: 2348134820569
Twitter: @Forexelyte


Friday, October 10, 2014

Is Usdcad prepared to resume the Uptrend?

I have been able to follow this pair nicely since July 6 when I predicted a powerful long term bullish move. Price was resting on the bear sides along the way and , each time it did, never failed to resume the bullish move.


Recently, on 5th october, I predicted a medium term correction after a perceived overbought. Price reacted as well and went down considerably with good profit         (already closed 80% of my position). 


You can take your time to read all my posts on Usdcad from July 6 to understand what I am talking about.


As we know, that a good trader or speculator doesn't stick to his thought about the movement of the market. He rather is flexible and adjust as price unfolds more information, and he reacts accordingly. He is less proactive and more reactive to price information. He reacts to what is happening and not what could happen.
 
A vivid look on this pair showed me that the recent bearish move we saw in Usdcad is a zigzag correction and price could resume the fifth wave to complete the 3rd wave of the larger uptrend.


Let me start with the weekly chart


What we are having is a motion and uncompleted  wave 5. By projection, it should end at the zone painted blue which is a confluence of equality ratio(wave 1 = wave 5) and 61.8% retracement of the last bearish trend. Price could be on its way to fulfill  this projection


Going by the 4H chart, a break above the wave 4 upper channel combined with a good bullish momentum should push price to 1.1364 which will be my first target if I decide to buy. 

On the other hand, if price is held there and turn down I could be on my way to reach my final target on the bearish note before thinking bullish.


Wednesday, October 8, 2014

Usdcad Intra day Update

On 5th October, I talked about an end of wave 5 on the 4H chart of this pair for a bearish move ( Read Here) .  

Price started reacting immediately to the bearish call and I cashed out 100pips on 50% of my position. 

The bearish move has paused and entered a consolidation ( triangle) which if broken downward will give a nice ride.


The bears still have the chance especially from the 1H intraday chart which shows how price is reacting to the expected  retracement ( 50% or 61.8%) of the wave 5.


If Usdcad breaks the triangle downside, it's either we have a wave 3 or c which could end at 1.1000 ( 161.8 % extension of a from b and 61.8% retracement of the wave 5 that I discussed on 5th October


If price breaks above the upper boundary of the traingle, I might look forward to exit the other 50% of my position.


I will keep an update as the market unfolds.

Tuesday, October 7, 2014

A New Look at Gold

On October 2, I was wondering if Gold was going to have a free ride down after breaking out of a triangle corrective pattern formed on W1 and another triangle on the intra day broken out after the US non farm payroll report (Read the story here)

I was expecting a pull back and then a bearish candlestick engulfing, but price went back to the triangle it once broken, giving me a reason to re-analyse. 

After spending some time, I saw price bringing out a new picture- a bullish picture!


With a new look at the weekly chart, I saw that price is bouncing off the support line of the triangle after it formed the fourth (a-b-c) zigzag wave to resume a resume the last (a-b-c) corrective move ( triangles move in five corrective wave before completion) which should move close to the upper line of the W1 triangle.

With divergence and momentum oversold at this region, it could well be a good thought- we have a chance.


On the daily chart, I see a completion of a 5-wave impulsive move that completed the fourth wave I mentioned above clearly: and with divergence,channel support and momentum oversold, the bulls are preparing to take the golden initiative

If the bulls are taking over, I will expecting a (5-3-5) upward move to the roof of the W1 chart.


As price adds more, we get its intention more clearly.
I'm here to update you, so don't be far

Let me add you to my mailing list. 
Send your E-mail address to Forexmaster05@yahoo.com
Whatsapp: 2348134820569
Follow on Twitter @ Forexelyte


Monday, October 6, 2014

UsdCad Is Overbought

Nothing interests me in this market more than seeing a pattern I recognise. On 6th July ,I speculated a long term upward move of this pair ( Read Here ) .


The bullish move that started on the aforementioned date is looking set to complete a nice impulsive 5 non-overlapping waves on the H4 time frame and I'm expecting a dip before price continues the long term bullish trend.


Presently, price has hit a strong resistance at 1.1275 with overbought and divergence signals on Macd and Stochastic respectively, it's not bad to think bearish, at least for intra-day moves.


I still maintain a general bullish bias but the bears could take a shot which could be profitable. Targets are 1.1025 ( 38.2 % retracement) and 1.0950 ( 50% retracement)


I will wait for a candlestick bearish reversal formation before embarking on the journey.


Conversely, if price broke 1.1275 in high momentum, then the impulsive move is not yet completed and more price candles will help to verify the next action.


Updates to come. Don't be far


Twitter: ForexelyteFacebook: Sanmi Adeagbo        

E-mail: Forexmaster05@yahoo.com to get alerts of my new posts  

BBpin:7FF79963    

 Connect with me on Whatsapp: 2348134820569 and Join our Forex group ( Forex sniper)


Friday, October 3, 2014

A new look at Cadchf

Before I start,please take time to read my last post on this pair (click here).


Price broke the triangle I talked about and went back immediately giving me no real chance of buying.


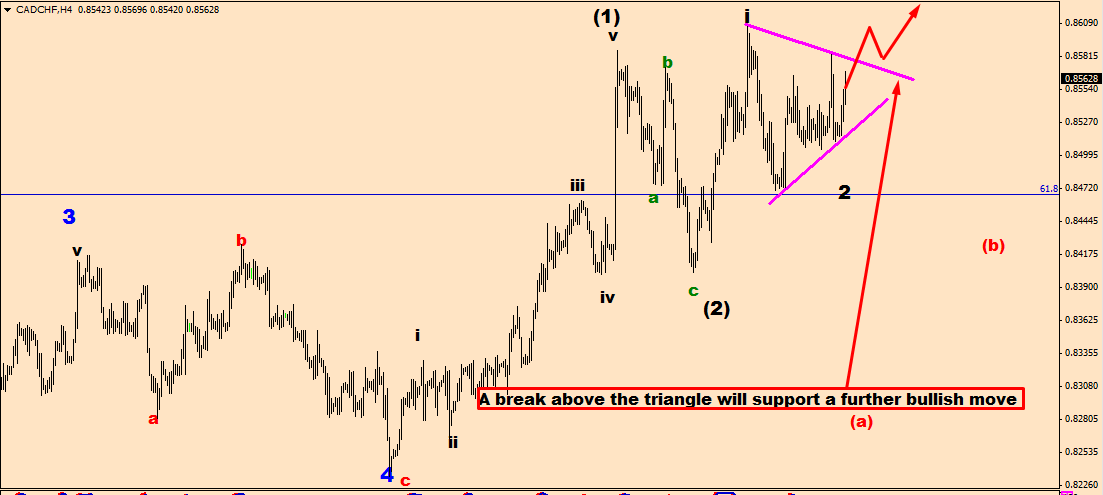
The congestion is not looking over yet as we have price moving up and down to form a larger triangle.


As price adds up to itself, we ask ourselves, are we still in line?. Being able to follow price and allowing it to connect with us is very important. That's why I chose elliot waves analysis as my primary tool.


With what price came up with of recent, it shows clearly that the first corrective wave ( wave 2) of wave 5 of the impulsive moves ( in blue) is about to be completed as a triangle corrective pattern. 

If this is anything to go by, we expect the price to break the upper line of the triangle for an explosive move upside. I will wait for a chance to buy at the break to target 0.8810.


Conversely, if price breaks the triangle downwards, what we will be having is a complex correction or temporary change in trend which requires more studies and patience.


Either way, price determines where it goes and we just have to understand him and follow. We should see a real action next week.


Connect with me on whatsapp: 2348134820569

Facebook: Sanmi Adeagbo

Twitter: @Forexelyte

BB Pin: 7FF79963

Let me also add you to my mailing list to alert you of my new post...                                                  E-mail: forexmaster05@yahoo.com

Thursday, October 2, 2014

Will Gold hit 1000 before the year runs out ?

In recent weeks, Gold has been trending down rapidly breaking barriers along the way. Will this dip continue? Well it's just a matter of time.


Going by the weekly chart,price broke out of a triangle in high momentum after 14 months of formation. This triangle marked the successful completion of wave 4 .

 Price is running down to complete this impulsive move which could end at 1000 ( the next support) before the year runs out


The intra day (H4) chart is not contradicting the bearish move. The bearish move that happened immediately after the triangle formation has successfully completed three waves.

 Presently, it's enclaved in the triangle of its own which will be completed at the successful break of the lower boundary of the triangle.


In the other way, price might break the upper boundary of the H4 triangle to test the resistance at 1240 thereby forming a zigzag corrective pattern instead of the current triangle before resuming the bearish move.


The breakout of the H4 triangle is very important to what corrective pattern we could have. A break below it will make gold dip and head to 1000 while a break above it will test 1240.


As price moves further, i will keep an update. Don't be far.


Let me add you to my mailing list to alert you of my latest findings.Send your e-mail to forexmaster05@yahoo.com

Ending diagonal on Gbpchf

I have some good runs on this pair and its stance to form patterns that I vividly understand makes me stay close to it.


Price is presently resuming the general bullish run which started in 2013. The general trend is Up! 


We saw the end of the 2nd wave zigzag corrective pattern and the resultant up move which broke  the resistance zone (indicated by the blue rectangle) showed that the correction is over and the trend has resumed upside.


Price is showing the end of wave 3 of the motive wave 3 with an ending diagonal which would make us expect a sharp corrective move downside. This resultant corrective move should end between 1.5430 and the support zone (1.5314-1.5280) before the bullish trend resumes.


Any dip below the support zone indicated will be a threat to the bullish trend.
I am expecting more price data/candles to ascertain the next big move
I will keep an update.


Wednesday, October 1, 2014

Cadchf In a Triangle

On 23rd of september, I posted my view on this pair based on elliot wave analysis, you can read here.


Price has not been moving downwards as i forecast. With more price candles formed especially on the 4H chart, I have now come with an alternative wave count. Let me stress it that the two wave counts are still valid until price proves one correct and the other incorrect.


Price presently is consolidating in a triangle pattern and a break below it will support the bears and the first wave count will thereby be valid.


Going by the alternate wave count, the 5-wave bullish impulsive move explained in the first analysis might not be ended yet, It could be the wave 1 of the 5th wave of the impulsive move which started from 0.8400 support level and the present triangle could be wave 2 of 5.

 If the triangle is broken upside, price should continue the upside move to 0.8690-0.8700 which is a strong resistance.


Breakout of the triangle should decide the next medium term movement of this currency pair and I will watch out closely to be part of the move.


I am presently out of my bear position. I want to be sure of the next move before I join again.
I will keep an update of this pair as price movement unfolds

Tuesday, September 23, 2014

Why I sold Cadchf

What we are having presently is price reacting to a probable end of an impulsive move on the daily chart which started in march.

This move is terminating at a resistance ( 0.8600) and price should start reversing in a new journey to 0.8150 (a support close to 61.8% retracement of this move).


This impulsive move is part of a retracement of the long term bearish move of this pair which could still move which could take us to as high as 0.8870 before the bearish move should continue.


At the moment, a corrective move is expected to 8150 and a bit below before the bullish renewal which could take us to 8870.

Monday, September 15, 2014

Eurcad Long Term Analysis

Hello folks.
Check the analytical charts below to grasp my view on Eurcad analysis for the short term and long term.


As price brings more data...I will update you


Thursday, September 11, 2014

Nzdcad Analysis

This pair is looking so interesting as a recognizable pattern is forming.
18th March this year signalled the end of the impulsive wave that started on 10th June,2013. Presently the price is correcting with a zigzag corrective pattern. 

We might not know when this correction will end for the bullish move to continue but we can calculate and forecast a possible reversal zone to end the correction.


The zone indicated below is very strong due to the confluence of  levels--50% of the impulsive 5-wave move, 161.8% extension of wave a from wave b,diagonal and and horizontal trendlines (strong support zone).


I will wait for the market to get to this zone and watch for action around there. If price doesnt penetrate the zone in high momentum, I will look for bullish reversal signals and buy...


Check the chart below to get the picture clearer.


Tuesday, August 26, 2014

Gbpchf Video Analysis


This was a video I recorded  on Gbpchf  few days ago, someone might find it interesting

Thursday, August 21, 2014

Bearish Momentum Could drag Gbpyen to the South

I have been watching this pair for some time now and I think there is something interesting emerging. 


With proper trend analysis, one could say this pair is on the downward trend on the daily chart. The recent bullish push could end soon for the bearish trend to resume.


Going by my normal wave and pattern recognition , I see a possible end of wave 4 to resume wave 5 downward.


The recent upward push is as a result of an ending diagonal/wedge pattern which is now at the sub-wave 4 of W-3. There is also a strong resistance (172.40-172.60) that could hold price against further push up to the W-1 region.


I will wait for a good bearish engulfing bar to sell at the resistance zone mentioned above with my stop loss at 173.00 ( where W-1 will be altered). My final target- Support zone ( 169.50).


On the other hand, if price pierce the resistance zone mentioned and move in the region of W1 I will withdraw the sell order. If price broke the resiatance trendline upward, we could see a deep bullish correction or even reversal.
I will watch as price tell me what next to do.


For Questions, Partnership, Mentorship and Fund management contact me:
E:mail: Forexmaster05@yahoo.com
Facebook: Sanmi Adeagbo
Twitter: Forexelyte
Phone: (234) 08134820569

Sunday, August 17, 2014

Possible end of Usdcad correction for the continuation of the BULLS

I have been expecting a wave 4 correction since July 30th when I had the last update on the usdcad continued bull move after an expected correction. 


Now, the correction looks like completed and I am expecting usdcad to push to wave 5 at 1.1050.


Long entry isn't bad but stop loss should be below 1.0820.The analytical chart below could prove helpful


This analysis is for educational purpose only and care should be taken in interpretation.


For questions, partnership, mentorship and other services , contact me below:
E-mail: sanmiadeagbo@yahoo.com
Facebook: Sanmi Adeagbo
Twitter: Forexelyte
Phone contact: (234) 08134820569


Why Nzdyen bull should continue

With a potential double bottom on daily chart, we might see a real move up. Get the gist with the analytical charts of daily, 4 hour and 1 hour time frame below


This analysis is for educational purpose only and care should be taken in interpretation.


For questions, partnership, mentorship and other services , contact me below:
E-mail: sanmiadeagbo@yahoo.com
Facebook: Sanmi Adeagbo
Twitter: Forexelyte
Phone contact: (234) 08134820569


Wednesday, July 30, 2014

How to Join the Usdcad Bull Party!

On July 6th, I predicted a bullish move of this pair and it hasn't disappointed a bit as I have been picking profits along the way, hope someone is doing the same?. You can read that analysis HERE

For those that didn't join the party, I perceive an opportunity to be a part at a crucial level that promises a beautiful risk/reward.

I still maintain a general bullish bias on this pair, but as we all know that markets retrace at some crucial zones to change its movement or resume.

I will be going by my usual wave counts and harmonic pattern analysis.

Starting with 1hr time frame, a crucial gartley will be completed at 1.0875-1.0890 ( a potential reversal zone ) and resting on different resisting horizontal and diagonal lines.


On the 4h chart, there is an end of wave 5 pattern about to be completed, probably at the zone mentioned earlier, if that should be the case, a reversal is imminent to drive price to indicated ''Quick target zones'' before the bullish move resumes.


In other words, price broke 1.0820 in high momentum,  a retest follows and the bulls continue.


The expected short bear is for short nap trades and if 1.0820 is bridged downward in high momentum, well, the party might be over.


Conversely, if the aforementioned reversal zone is broken high and high, the bus is not waiting now and it's all well.


Note: Make sure you understand this analysis before interpretation. It's not a call for trade. It's the view of a trader and caution should be taken.It's for educational purpose and not a call for trade. You can contact me if you have any questions


For partnership, fund management and mentorship, you can contact me
E-mail: sanmiadeagbo@yahoo.comFacebook: Sanmi AdeagboTwitter: ForexelytePhone contact: (234)8134820569
You can also post your comments and questions below

Tuesday, July 29, 2014

Eurusd Short and Long term Analysis

Hi folks, it's been long I haven't posted here. I am sorry for not have been around. Of course a lot of things have happened. Recently deepened myself into some studies. I just love my charts- like my wife . 


Well, here is my analysis on the most popular pair-Eurusd


Taking into account the H4 elliot wave analysis on the bearish move from 1.3700, wave 3 is about to be completed after completing a 5-wave elliot swings and resting on a diagonal support, a push to 1.35100 resistance is thinkable and highly probable in order to give us a wave 4, from where we can sell again for large profits.


On the daily chart, 1.3510 was bridged convincingly and a retest is possible for a further push  down to 1.3300 ( A support)  and 1.3100 ( convergence of nearly 1.618% extension of wave 1 from 2 and a level of support).


I expect Eurusd to retrace and them push down. I am still strongly bearish but I am going to take a bull short aiming 1.3510 or lower
The analytical charts below on H4 and D1 will give you a clearer picture.


NB: This analysis is risky and care should be taken in interpretation. You can drop your comment or mail me if you have any question . Please this is for educational purpose and should not be taken as a call for trade.E-mail-sanmiadeagbo@yahoo.com

Facebook- sanmi Adeagbo          twitter- Forexelyte

Phone no: (234)08134820569Please let me know if this blog has been helping someone by your comments  and you can also contact me if you need a trading partner,mentor or fund manager


Monday, July 7, 2014

Why Selling GbpChf is not a bad Idea.

This bearish run on this pair is imminent and it's just a matter of time. With mouth-watering patterns forming, potential pips are to be made shortly with the weekly, daily and 4hourly charts embracing the bears.


On the weekly chart, a successful BAT has just been concluded just at the roof of a strong resistance trendline.


On the daily, a bearish BUTTERFLY is completed with an engulfing bearish candlestick pattern forming.


The terminal zone ( 1.5280-1.5380) is a very strong price reversal zone.
In the analytical chart shown below, I analysed with the D1 chart only in order to see a PICTURE ( how a BAT  is pregnant of a BUTTERFLY) and all these are happening at the roof of a channel. Thinking bearish in this case isn't bad at all.


Going by the 4 Hour chart, an end of wave 5 Wave-pattern has been successful at the same resistance level afformentioned. and unsurprisingly, 4H has responded to the bears in its own way waiting for the big boys to join the move to provide an explosive run before the bulls will wake up, if they wake at all.


With all these, I see price coming to 1.5185 ( short term), 1.500,1.4920 and 1.4816 before the bullish would gather momentum to counter the move. If the rising pink trendline on D1 is broken down-side, price could be broken loose to 1.4150 and below. It's just a matter of time.


NB: This analysis is long term and care should be taken in interpretation. You can drop your comment or mail me if you have any question . Please this is for educational purpose and should not be taken as a call for trade.


Please let me know if this blog has been helping someone by your comments  and you can also contact me if you need a trading partner,mentor or fund manager
E-mail-sanmiadeagbo@yahoo.comFacebook- sanmi Adeagbotwitter- ForexelytePhone no: (234)08134820569


Sunday, July 6, 2014

Why I bought Usdcad

Let me start from the bigger picture- the weekly chart. This pair is setting to form a potential 61.8% gartley pattern at 1.170 and its neighbourhood and  wave analysis in support of this potential makes this thought stronger.


Going by the wave count which started July 2011; wave 3 has successfully completed at 1.1266 and price retraced to the present level ( a potential wave 4) and I am expecting price to push up from here or anytime soon and break the wave 3 to form a wave 5.


1.1700 is a very strong price magnetic zone due to the convergence of Fibonacci extensions and retracement  (check the weekly analytical chart below) and a Resistance . Wave 5 could potentially end there.


How are we sure, to a certain degree, that wave 4 will be formed there. This can be answered by zooming down to the daily time frame.


Now, to the daily time frame. Price has successfully completed a gartley pattern (check the daily analytical chart below) and I expect a big move up.
I started buying on 3rd of this month and I’m still holding on with stop loss at 1.0560 and targets at 1.0800 and 1.0950 for the time being. I expect price to break 1.1280 to form a new high at 1.170 or thereabout .


On the other hand If price go down to break 1.0500 with high momentum, this analysis is invalid and I might have to look again.


NB: This analysis is long term and care should be taken in interpretation. You can drop your comment or mail me if you have any question . Please this is for educational purpose and should not be taken as a call for trade.


Please let me know if this blog has been helping someone by your comments  and you can also contact me if you need a trading partner,mentor or fund manager

Facebook- sanmi Adeagbo
twitter- Forexelyte
Phone no: (234)08134820569

Monday, June 9, 2014

NzdYen Outlook

This pair if forming clear wave patterns. we recently have a bullish retracement which could be the end of Wave-4. 

The speculated end of Wave-4, which is supported by a strong resistance formed by the confluence of horizontal and diagonal trendlines, should make us prepare for southern move below the low of wave -3. 

We can take profits at different prices if the bearish move is actualized.


The Analytic Chart below speaks what I have in mind better.


Please let me know if this blog has been helping someone by your comments  and you can also contact me if you need a trading partner,mentor or fund manager

Facebook- sanmi Adeagbotwitter- Forexelyte

Phone no: (234)08134820569


Cable bearish look

Cable's drastic bullish move which started on 21st March ended with more than 500pips at 1.6995.


 The price has since taken a correction to the downside with beautiful swings at good levels.


The present bearish move could still continue till 77.8% retracement of the bullish move at 1.6560-1.6600 before fresh bullish move could continue. 

If price penetrates below 1.6468, the bears might be preparing to take over.
Presently, price has formed an ABC zigzag Gartley pattern (50-61.8% fib-level) at a strong resistance formed by 2-diagonal trendlines. 

Any move from this level to the downside will suggest that Wave-3 is not yet completed ( at least its minimum projection).

Going by this thought, it's not bad to speculate that wave 3 could occur at 1.6560-1.6600 which is a magnetic zone for price due to different projections that converge there. 

A new buying interest should be expected there after we might have exhausted profits at different levels along the way.
A break above 1.6850 will make this scenerio invalid and might force price to resume the bullish run.


Perhaps the analytic chart below can explain better to you


Please let me know if this blog has been helping someone by your comments  and you can also contact me if you need a trading partner,mentor or fund manager

Facebook- sanmi Adeagbo
twitter- Forexelyte
Phone no: (234)08134820569


Wednesday, June 4, 2014

EurYen Analysis and Outlook

Those that sold this pair in late April and early May and stay long enough should be dancing ( I wish I was one of them). A nice bearish move from Euryen.


Recently we are having a bullish correction push which could end at a major level for the bears to resume. Good and patient traders that are not in any position in this pair will be waiting. Yours sincerely is one of those people.


This pair, presently is trying to break the Resistance 140.00 and we can see some pins forming around there. 


I see the big picture at 141.00- 140.50 level. This level will complete a deep bat harmonic pattern and together with the strong bearish resistance trendline, we have a magnetic CONFLUENCE  area. 

We might not be able to know correctly where this reversal will be but we can predict possible levels, lay AMBUSH and act accordingly


I will wait for a bearish signal at this level and pull the trigger when I see something convincing enough. If this should happen and the bearish move resumes, then we can host a party of Euro and Yen pips and ride down , down and down........


Conversely, if price breaks the aformentioned level in high momentum, well the bull might take over and we can now re-analyse.


Please let me know if this blog has been helping someone by your comments  and you can also contact me if you need a trading partner,mentor or fund manager

Facebook- sanmi Adeagbo
twitter- Forexelyte
Phone no: (234)08134820569


ENJOY 60% BONUS AND 1 YEAR FREE SIGNAL AND MENTORSHIP

AudCad Analysis.

Of recent, this pair has been experiencing nice wave movements up and down. The medium term is bearish!


The recent upward push we are experiencing might be a correction after which the bearish move will resume.


The reversal level indicated below signal a possible end to a potential wave-4 movement. This is not just a movement but a 3 swing ABC wave pattern movement or what many harmonic traders know as Gartley harmonic pattern if the fib-ratios are added. The fib-ratios added make the indicated reversal zone,a strong magnetic area for price to reverse.


There is a potential gartley forming under a strong trendline and a rough resistance, so the outlook is bearish
Presently, market is looking like wanting to reverse from this level which could possibly happen but care should be taken before entry as there is room for more pips upward.


My entry strategy has not pushed me to sell yet and when it asks me to...well...who am I?
If the entry is satisfied and Aucad decides to move in this direction, we might see Audcad dropping below 1.0000.


On the other hand, if the aforementioned resistance reversal zone is broken upward with a strong momentum, the scenerio will be invalid and we could see this pair soar to 1.0254.


The analytical chart below explains more


Please let me know if this blog has been helping someone by your comments  and you can also contact me if you need a trading partner,mentor or fund manager

E-mail-sanmiadeagbo@yahoo.com

Facebook- sanmi Adeagbo

Twitter- Forexelyte

Phone no: (234)08134820569


Monday, June 2, 2014

BRING ON THE NFP

I was going out this morning expecting to come back and see signals for Eurnzd sell. None of my entry strategy rules was satisfied.


I flicked through other pairs when I saw a nice opportunity to ride Usdcad. I bought more lots than I usually do because of the small volatility of this pair


It paid out well as my first TP was hit and the second was about to


While I expect this pair to rise higher, there are two barriers - 0.09100 and the NFP.With profit locked and more to come before Friday...I can say '' BRING ON THE NFP''


Sunday, June 1, 2014

EurNzd Update

If you have been following this blog closely, you would have noticed that this pair has not yet reached the minimum projection level for wave 5 mentioned on 29th April ( read here) .


The wave 5 move started strongly expectedly didn't go straight to hit 1.56s and below, which are the projected levels.


Presently, we have an abc 61.8% gartley zig-zag correction pattern resting on a strong resistance and with D1 formed a pin and a doji candles at this level, it's not poor thinking that Eurnzd might soon fall and 1.55s are the targets.
 An aggressive trader might want to sell from here while a conservative one would wait for a break of 1.5935 support formed by the up trendline on 4H.
 I will wait for my entry parameters before activating a sell and take profits at 1.5780 and 1.5550.


Please let me know if this blog has been helping someone by your comments  and you can also contact me if you need a trading partner,mentor or fund manager
E-mail-sanmiadeagbo@yahoo.com
Facebook- sanmi Adeagbo
twitter- Forexelyte
Phone no: (234)08134820569

My Result for the month of May

Total number of trades: 9
Won trades: 5
Half winner: 1
Lost trades:2
Breakeven: 1

Results in pips:

Won trades:
Gpbaud: +350pips
Audnzd: +150 pips
Eurnzd: +250 pips
Euraud: +200pips
Gbpusd: +120 pips
Total pips: +1070

Lost trades:
Audnzd: -25pips
Usdchf: -75pips
Gbpaud: -1pip ( break even)
Total pips lost: -101pips

Net pips: +960pips

Running trade: UsdJpy closed half trade with 45pips, second part running at breakeven

I hope next month will be better than this
Related Posts Plugin for WordPress, Blogger...