Tuesday, March 8, 2016

Gold: A New Triangle?

On 3rd March, we discussed about the triangle that formed the 5th wave of the expected impulse wave that broke out of the ending diagonal. You can read the article again here .

The impulse wave, which was expected to terminate between 1300 and 1400, is expected to be the first leg of a correction.

As price broke out of the 4th wave triangle, we expect price to rally in a real motive wave to the 1300-1400.


Presently price is consolidating in a side way movement after a short rally.
The chart below shows the Elliott wave analysis of the breakout rally


If price breaks above 1275.21, there will be a good position for price to rally to 1290-1300 in the nearest term.

Subscribe to this blog to alert you of good trading analysis, set ups and positions.

Thursday, March 3, 2016

Intraday Analysis; Cable to continue the bearish move.

Cable is expected to continue the downtrend which is projected to halt at 1.1740.
Price is about completing the 4th wave of the intra day trend and we may see further dip especially if price is contained below 1.4150 resistance.


If price is contained beneath the zone (1.41-1.415) and breaks below 1.404, we may see price dip to 1.372 which is the next projected support level.

Wednesday, March 2, 2016

Gold: Do We Have a Triangle?

Do you still remember the movement of Gold; the ending diagonal that signaled the end of the impulse wave from $1920?

Price was expected to break out of the diagonal with a corrective pattern starting with a 5-wave drive or a 3-wave.

We seem to be having the 5-wave drive as price broke out of the diagonal ferociously . The forming 5-wave signaled that corrective pattern we are expecting could be a zigzag pattern or its extension/variety.


The first leg potential 5-wave is about completing its 4th sub-wave with a clear contracting triangle. A break above this triangle upside could move price to 1300 or higher to 1400.

Nzdcad: The Long Term Correction Upside Is Not Over


The weekly chart above shows the activities of price from 0.6908 to 0.9675 and back to 0.8111. Price is in a long term bullish move. The rally is corrective and is projected to continue to 1.0861. Quite long...huh?

The projected corrective pattern is a double zigzag .

The recent dip in the 4hr chart below is a double zigzag correction which is projected to end at 0.8895-0.8750 before the rally continues.


If price advances and breaks above 0.899, there will be a good buying opportunity.

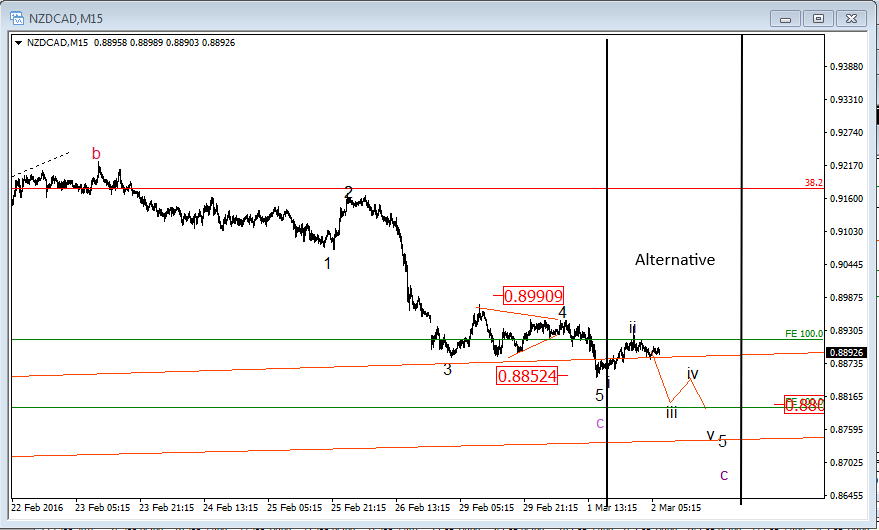
Price can alternatively, as shown in the 15min chart below, dip further to 0.88 regions and it will be good to look for buying signals


You can watch the video of this analysis below


Have you subscribed to my newsletter?. Sign up at the  right top corner to get market analysis and signals sent directly to your E-mail.

Friday, February 26, 2016

NzdJpy: Would these combined corrective patterns trigger a bearish move?

On 16th February, I did a video analysis pointing at a long term flat pattern emergence. See here .


The chart above was used in the analysis.

Price is projected to move in a motive wave and the first wave is still in motion, probably in the final phase i.e the fifth sub-wave.

With price projected to dip to the 70 price region with about 600 pips away and a motive wave, an impulse wave or an ending diagonal.

The video below explained further how price could move.


The second sub-wave of the fifth wave is complete and price is in motion to complete the third wave.

See the chart below


The chart above shows how the third wave of the 5th sub-wave is emerging. A combination of zigzag pattern followed by two different flat patterns shows that the recent intra day bullish drive will soon be exhausted for the bearish trend to continue in journey that could get to 70 price level.

The chart below shows the plan.


Subscribe to our mailing list to send the alert to you.

Tuesday, February 23, 2016

Gbpchf: 2 Emerging Patterns To Consider A Short

After the 5-Wave decline that broke out of the long term ending diagonal, we saw a shallow retracement which was resisted by the 4th wave of the 5-Wave drive at 1.4750.

Price dipped in a lower degree 5-wave impulse and has been congesting since 9th February.

If price does not dip below 1.3890, we might see a further intra day rally to 1.4310-1.4320 before the bearish trend resumes.

We have two projected scenarios in place; any of which,if satisfied, will make us look for a selling opportunity signal.

Scenario 1


Scenario 2


Watch the video below.


Thursday, February 18, 2016

Gold Intraday Triangle

Gold is presently in an intraday triangle pattern. If price breaks it down , we might see Gold selling at $1152.
Watch the following video

Tuesday, February 16, 2016

NzdJpy Forecast: Many opportunities abound

On the weekly chart, there is an emerging flat pattern which can make this pair drown in many years to come.
There are so good opportunities that are inherent.
Price is expected to continue the current dip till it retraces at a level shown in the video.

Watch the video and you may position yourself  for good profits.
If you want me to alert you, you can subscribe to my mailing list or ask for my signal service.


Monday, February 15, 2016

GbpJpy In a correction upside?...How to take advantage!

In the last video I released, I made an analysis of how I intended to sell GbpJpy. My sell entry was satisfied and I sent a message across to my subscribers to sell GbpJpy which gave us more than 800 Pips.

We are already out.

This is the new view . Watch the video below. If the forecast is satisfied, we will consider buying at the price mentioned


You can subscribe to our signal service or join our mailing list for accurate and high probability trade set-ups.

Wednesday, February 10, 2016

A Triangle In AudNzd: Bullish Expectation

The analytical chart below was posted on 16th December 2015 in the article titled AudNzd: What we expect next 


https://blogger.googleusercontent.com/img/b/R29vZ2xl/AVvXsEgBVx_uYvMW2YWWYxEylYD9aZZr1O54xVhbKbss3HqaPpeHErVMP2KX4iz062hvyLeibNFbg1GHvLsN2q9aGu10OAvW0omy8tw5SFVn905NdV88xi645evh4piahruayZspf4_gePTB1R4/s1600/Audyen+dec...weekly.png

It was so clear to us that price was in a corrective rally after a 5-wave impulse fall off. We also had  an inverted head and shoulder pattern in line. We though that if price rallied to 1.4526 as expected in the manner highlighted, it will further show how other technical systems are engulfed by and subsumed in Elliott wave theory. Elliott wave theory caps them all in a 'big brotherly' manner.

The expected rally was expected to be a 5-wave motive move in what should break above 1.14526 (the neckline of the inverted head and shoulder) and Elliott pattern traders would have been making god pips before chart pattern traders get a confirmation from the breakout.

In the same article, we posted the chart below to track the Intra day Elliott wave pattern that would trigger the bullish ride.


We saw a tripple zigzag pattern and made this proposition
If price is contained above 1.05 and rallied to break above 1.077, we will be prepared to get in line with a long position aiming 1.1548 as the final future price level.
That was the condition to consider a buy trade.

Price never rallied toward 1.077 but rather dips below 1.05 and thereby stretched the tripple zigzag. We dropped it since then and decided to take it back when it is clear what corrective pattern will emerge to drive price up.

We seem to find it in the chart below : A triangle pattern.


The chart above shows that the correction we are seeking for could be a triangle pattern. Triangle pattern often occur at the 4th wave of a motive wave and the b-leg of a corrective wave.

We expect price to be contained above 1.051; a rally from the present level to break the triangle upside should trigger a buying trading opportunity to 1.22 which is an important level.

Don't forget to be part of our mailing list or subscribe to any of our services.

Monday, February 8, 2016

What Did You Do With The Gold Rally?

On 21st December 2015, we forecast a rally after an ending diagonal formation which terminated the impulse bearish move since 2011.

Read the analysis HERE

We expect price to go higher.

Watch the video below

Sunday, January 31, 2016

Elliott Wave analysis of Crude Oil, Gbpjpy and Usdcad

The video below shows the weekly analysis of Crude Oil, Gbpjpy and Usdcad.

Position yourself for the week.


To view and download our trading result of the last 3 months.
 Click here

Trading Result

Forex Sniper Signal Service started late October 2016.
In the first three months , we have made more than 4000 pips and have averaged a 81.8% winning ratio.

Please click the link (date) below to view/download the result

1. Late October 2015 to January 2016         Result:   4424 Pips

Saturday, January 23, 2016

Trading Result on Gbpchf and Eurgbp: 18th - 22nd JAnuary 2016


In the last post, there was an expectation for a diagonal bullish turn-back at a specified level. The last leg was expected before the move. Price did exactly as we forecast and we took a bullish position.

You can watch the video below to see how we took the trade with Eurgbp. You can subscribe to any of our services . Just click on the home page menu tabs.


Monday, January 18, 2016

Intraday Analysis: Gbpchf

In the last two videos I updated, I noticed that Gbpchf is in the process of a 5-wave impulse bearish move after breaking out the long term ending diagonal in the article titled All Eyes On Gbpchf

The 5th wave of this impulse wave appears to be an ending diagonal as seen in the chart below.


If price completes the leg and breaks above the ii-iv connecting resistance trendline as shown in the chart above, there will be a good buying opportunity . Price will be expected to move towards 1.4800 level.

Price is expected to be supported by 1.4160. A break below will make this forecast invalid.

Join my online elliott wave mentorship/training . To learn more click here
To get trading tips, analysis and signal mail Forexmaster05@yahoo.com

Monday, January 11, 2016

Weekly Elliott Wave Analysis (11/01/2016)

The elliott wave intraday and long term forecast and analysis of Gbpchf, Audchf, Euraud, Gold, S&P 500, Usdcad, Crude Oil, Dax 30, Eurgbp, Usdjpy


Friday, January 8, 2016

If You Decide To Learn: Join Us


Online trading is fast becoming one of the most popular businesses that can be done on the INTERNET.

Despite the risk involved in it, the daily trading turnover is getting more huge and more people are getting involved in the act.

Over the years I have come to discover that, to win in Forex, Commodities or any other financial markets, there is a need to learn and learn.

Winning starts by identifying no-nonsense high probability trades and having the patience to run them through.

Winning is not about the number of trades, rather the number of quality trades and the patience and discipline to execute them.
One other thing__ good money management.

This blog, if it has shown anything, has proved that Elliott wave theory is the best markets forecasting tool- not just that- and also provides opportunities to trade high probability trade set ups with well defined entry, targets and exit levels.

Click here to learn why you need to learn Elliott wave theory .

Let's look at a few of Elliot wave patterns that were posted on this blog.

Just recently, we spot an ending diagonal pattern on Gold daily chart. The diagonal was clearly formed at a well measured convergence point.

The article titled Gold Rally is imminent; how prepared are you? was posted on 21st december


Price has since risen to 1102 from 1065.85 (about 400 pips) is a move that is expected to continue upside.
If you read the whole article, you'd see that the diagonal pattern we traded was in line with the general expected price movement.

As price is expected to surge higher, we provided an alternative in the article titled Gold Expected Rally; An alternative view.

We are still on diagonal pattern.

#Gbpchf

The chart below was posted as part of our analysis on Gbpchf titled Gbpchf: The Long Term View


The diagonal pattern was not yet complete and we made a forecast of what is required for the completion.
Of course, price moved exactly as we wanted.

The pattern completed at the region we forecast and what next? We sold and send trade recommendation to our subscribers.

The chart below shows how price responded to the pattern formation.


We made 700pips out of this move risking only 280pips. Is this for real? Absolutely!

Let's look at another interesting diagonal we traded.

#Gbpjpy and #Usdjpy.

Infact, if you have followed all the diagonals we discussed, your accounts should be smilling.

Read articles that show the power of the diagonal. Please take your time and check what happened after the formation on your chart.
Here we go:

On 13th August 2015. An article titled Gbpjpy: When will the bears take over?

On August 23, 2015. Read article titled What drive the diagonals?

At a time , we were posting intra day analysis of some currency pairs. Look at how we follow the price till we get a diagonal and how price reacted to it. Click here

What about Euraud rally after the diagonal.... an article posted on 8th June 2015

.....and an intra day ending diagonal on Gbpusd trade on  22nd February 2015

Before I go; what about the recent one we sent on Audnzd?... Are you among those that received the signal?

Read it here

Massive...right?

Let's look at another pattern...The Zigzag

The ones that easily come to my mind are the recent ones on AudJpy and GbpJpy (double zigzag)


#AudJpy


This was spotted on AudJpy on December 2, 2015. The x wave was a clear zigzag pattern, though we didn't zoom to a lower time frame to show its constituent waves.


We sent the signals to our subscribers. The pattern was clear and price respected it.


GbpJpy was more interesting. We forecast the  pattern and the requirements for us to consider a sell trade. Price did exactly as we have forecast and BOOM!...... Our subscribers enjoyed this most.


The good thing is the risk/reward ratio, we only risked 280pips.

There are so many zigzag and double zigzag patterns we mentioned on this blog.

Just type 'zigzag' or 'zigzag pattern' in the blog's search box at the top right and read many other zigzag patterns. Read the requirements and if price responded. Where price responded, check the outcome on your chart.

Elliot waves theory has 5 core tradeable patterns.
Others are
Triangles... Read our exploits on Eurusd on 4th August 2015 (click the date to read)
The flat pattern. Example is the Usdcad buy set on 27th October 2015

and  the non-overlapping 5-wave pattern generally known as Impulse wave ( probably the most popular elliott wave pattern)
An example... read the forecast on June 22 2015 and the outcome on July 13, 2015

Impulse wave appears most frequently. I am just too lazy to bring our many examples for you.

If only one can be patient for these patterns to complete, they are very reliable.

Why You May Want To Consider Trading Elliot Wave Patterns

1. They are very reliable if all the rules and guideline are kept. Are they perfect? No. The winning ratio is at an average of 70% i.e you will win 70% of your trades if you can recognize 'textbook-like' clear Elliot wave patterns like the examples I gave above.

2. They can compliment other trading systems like Price Action, Chart patterns and harmonic patterns.

3. They can be confirmed by your set of indicators to give you more confidence.

4. Minimum risk/reward ratio is 1:2. You will always win more dollars when you win than the dollars you lose in a losing trade provided you risk a fixed dollar value for each trade.

5. Elliot wave patterns are best traded at demand and supply levels so support and resistance traders will find them useful.

6. If you go further in the study , Elliot wave theory can be used as a forecasting tool for any market, be it commodities, currencies, energies, stocks, indices, real estate, Etfs or strategies that can be used to trade options, binary options e.t.c

7. They can be used for long term, swing and intra day trades. I do more of long term and swing. They are perfect for intraday trades as  well.

In fact, every serious trader should learn how to trade with Elliot wave theory.

Okay, enough of story.

I have put together, a 2-month Elliot wave mentorship programme for you in which I will reveal how I trade elliott wave patterns.

The mentorship will not teach you the in depth, confusing and complex academic Elliot wave theory. It will simply be about how to recognize no-nonsense high probability elliot wave patterns in any market and time frame.

How you can use elliot wave theory as a simple trading system i what you want, isn't it?

The outline of the mentorship course is highlighted below.

1. Basic tenets of  Elliott wave theory (EWT)
2. Rules and guidelines
3. The 5 core Elliott wave patterns briefly.
4. Trend Patterns in details (with rules and guidelines)
5. Corrective patterns in details (with rules and guidelines)
6. Fibonacci ratios in price and time
7. Ratio relationship of trend patterns
8. Ratio relationship of corrective patterns
9. The role of support and resistance and trend line analysis in support of Elliott wave patterns.
10. Reversal signals with candlestick patterns and indicators.
11. Momentum analysis and divergence.
12. How to trade the 5 patterns
  • Specific entry levels
  • Profit targets
  • How to set stop loss
  • How to exit a trade
  • How to adjust stop loss with respect to market conditions
  • How to take sequential profits
13. Money management/ Risk/reward ratio
14. Relationship between Elliot wave patterns and harmonic patterns and how to use them together.
15. How to use Elliot wave to confirm chart patterns

And many more.

At the end of the 2 months programme, you will have gained the better knowledge of the markets and how to wait for the right set ups.

You will learn how not to panic.

Duration: 2 Months

Starting date: February 25, 2016
 

How The Training Will be delivered
1. The outline is broken down into small pdf notes and video tutorials (recorded by me). lectures will be delivered 4 times a week. Weekends for questions and answers

2. For each lesson, there will be examples from past and present price charts. For each lesson taught, all participants and I will brainstorm with many examples from the chart until the lesson is nailed.

3. Assignments will be given to all participants to label random charts and identify inherent trading opportunities.

4. Participants will learn how to use Mt4/Mt5 analytical tools for easy analysis.

5. I will ensure to answer all questions in the best way I can.

6. Training will be delivered through a secret Facebook group

7. Many more discoveries I plan to reveal and those I will end up sharing in the course of the programme.


MATERIALS FOR ALL PARTICIPANTS: 

The best of elliot wave materials from R.N Elliot, other pioneers and researchers of elliot wave principles and some of my latest discoveries (unpublished).

Cost:  #25000  or  $150


How To Register

1. Send an interest message to forexmaster05@yahoo.com or to +2348134820569.

2. You will receive the payment details

3. Make payment and notify me.

4. Once your payment is confirmed, details on how to start the training will be sent to you.


You can contact forexmaster05@yahoo.com for one-on-one online training mentorship on  elliot wave or for signal subscription.


Forex Sniper Signal service is launched on Facebook. Please like and follow.


Thanks.

Sanmi Adeagbo

forexmaster05@yahoo.com

+2348134820569


Wednesday, January 6, 2016

Gold Expected Rally: An Alternative View.

On 21st December, 2015, we posted a forecast on an expected Gold rally. We quoted thus:

Gold might still fall in the future to $671.11 after an expected rally to $1450-1500 price levels
 This view was supported as a result of a clear 5-wave impulse wave from $1920.50 which was expected to be supported above $1000; and was labelled as a clear 5-wave.
We posted this chart.


The 5th wave is an ending diagonal pattern formation . It can be seen in the daily chart below as we have posted in the analysis.


Read the full analysis here.

Price is expected to rally and if it breaks the demand trendline of the diagonal, it will be expected to soar to $1399 and above.

Price will be expected to rally, if the diagonal is completed, in a motive wave.

Meanwhile, we have an alternative view.
Can price rally a bit and then dip further below $1040?... Yes it is possible.

The chart below shows a clue.


It can be seen from the chart above that the first four waves of the diagonal are typical 3-waves corrections. The 5th wave can form the same pattern- rally in corrective waves and fall to be contained by $1000.


The chart above is the hourly chart which shows the first leg of a probable 3-wave 5th leg of the diagonal. A rally up and then a dip down will be expected if the rally is corrective.

The first four waves of a diagonal are usually 3-wave drives, the 5th wave could either be motive or corrective.

Price itself will prove which of these scenarios will hold.

Our subscribers are already in a buy position since december and we are watching closely to see how price reacts if a bit of rally will happen or a total breakaway.

Like our Facebook Signal page

To join the next elliot wave mentorship programme, coming up on 25th February 2016, send a mail to Forexmaster05@yahoo.com

Monday, December 21, 2015

Gold Rally Is Imminent: How Prepared Are You?

Since 2011, Gold has been on a free fall from $1920.5 per ounce and now, only been supported by a psychological $1000 price level.

I labelled the rise to $1920.5 a 5-wave impulse.

From a larger forecasting point of view, Gold might still fall in the future to $671.11 after an expected rally to $1450-1500 price levels. All these will be, if the correction from $1920.50 will be a deep or complex zigzag corrective pattern.

Of course, we can always adjust our analytical forecast as price determines evolving patterns.

Right now, what we see is a clear 5-wave fall from $1920.50 which is labelled as the first leg of the correction of the impulse wave that ended in September 2011.

The weekly chart below shows this clearly.


The second leg, a prospective 3-wave rally, is expected to end around $1450-1500 price levels.

More so, the fifth wave of the impulse dip from $1920.50 is a clear ending diagonal pattern which gives us more confidence as to the expected rally. This is shown in the daily chart below.


$1000, a psychology price level, is expected to hold as a support. A dip below it could hamper the price of Gold going up.

A break above $1100.35 should trigger a long trade as price is expected to break above $1193.7 and to $1300.46 in the medium term.

Let's alert you of high confidence trade set ups. Join a group of happy traders who have been receiving our trade signals both free and premium. We made over 2000pips last month.

Send your request to Forexmaster05@yahoo.com

Wednesday, December 16, 2015

Audnzd: What We Expect Next

As a technical analyst, it's essential to learn different technical approaches to market prices.

Elliot wave theory, chart pattern analysis, fibonacci harmonic analysis, candlestick price action are some of the effective elements of technical armory every chartist must equip himself with.

On October 29th, an analysis was posted here on Audnzd titled Audnzd: Upward trend to continue?.  We discussed about a 5-wave bearish elliot wave impulse pattern as seen on the weekly chart.

After the end of the impulsive wave, a 3-wave correction , as expected, seems to have started as price rallied from 2015 low.

We narrowed down our elliot wave count to the hourly chart as we got a bullish trade set-up which we quickly shared with our subscribers.

All our profit targets were hit; though we were forced to close some of our trade before the final target due to a bearish reversal warning in the article titled: Audnzd: A Technical Combination.

Price rallied further, hit all targets and started falling as expected.

Will this fall continue or price will resume the rally?

The chart below is the recent weekly chart.

There is a prospective inverted head and shoulder reversal chart pattern subsumed in what could be a complete elliot wave cycle.


A complete elliot wave cycle is a 5-wave impulse trend wave followed by a 3-wave correction in the opposite direction of the trend.

With our wave count, we presume that price is still in the wave-C of the correction expected and the second wave of the C-wave is expected to end soon.

The 2nd wave of wave-C is a hourly tripple zigzag corrective pattern supported by a confluence zone.


If price is contained above 1.05 and rallied to break above 1.077, we will be prepared to get in line with a long position aiming 1.1548 as the final future price level.

Join us as we ride the trend together.

Our free signal service started last month with a 100% wins on 5 trades profiting about 2000pips.


You can take control of your trades and funds with our analysis and signals as an aggressive or conservative trader.

Send your E-mail address and phone number to forexmaster05@yahoo.com  

Wednesday, December 2, 2015

AudJpy May Continue Downside

We have been watching the long term historical activities of this pair for some time now but waiting for the right moment to follow the bearish trend move.

The move from 55.23 (in year 2000) to 108.275 ( in year 2007) was a clear 5-wave impulse (as illustrated in the chart below).

After such a move, one would expect a 3-wave correction (according to elliot wave theory). The corrections, though varying and complex in nature, are easy to spot.

The good thing about trading the elliot wave theory is that short term opportunities can be spotted within a large time frame and still following all the rules and guidelines of the wave theory. One can forecast a long term market move and trade clear patterns in the direction of the trend.

From 108.275 to 54.91 wave w ( a 3-wave decline) and back to wave x at 105.4 (a 3-wave rally), one can anticipate a double zigzag decline in labelled (W,X,Y in blue) which could end at 55 price level or below.


How can we take advantage of this forecast?, we can go to a lower time frame and read wave theory and price activities using combinations of technical tools.

The decline from 103.46 has completed the first leg of a double zigzag pattern and now correcting to 91.2 region. We expect price to be contained below 91.27 below the falling trendline. There is so much fibonacci ratios converging in that region. We expect it to be strong enough to keep the correction exhausted.


If there is a short opportunity below 91.27, a good ride could happen as we follow price decline further to 71.86

Let's alert you of any trading opportunity we spot.
You can send your E-mail address to Forexmaster05@yahoo.com for high probability forex signals. 

Monday, November 23, 2015

All Eyes On GbpChf

In the last update on Gbpchf, (read) we were expecting price to rally in 3-wave to complete an ending diagonal which is meant to be the wave C of a larger degree flat corrective pattern.

It was maintained that
If price is contained below 1.5600 and breaks below the trendline connecting wave 2 and 4 of the diagonal, there will be an opportunity to put a long term sell order to ride to 1.38 and below.
 With a probable completion of the pattern, there is a high likelihood of a long term bearish move especially if price is maintained below 1.56.

A conservative long term trader can look for a bearish opportunity as price breaks below 1.4800 ( i.e the wave2-4 trendline)


An aggressive short term trader may enter earlier at the break of  1.5350 to ride to 1.4950 and below 1.4800.


Get free and high probablity trading signals and analysis forward your the E-mail address and mobile phone number.

To get started;
Send your mail and phone number.
 Forexmaster05@yahoo.com


Sunday, November 15, 2015

Will GbJpy crash again?.....And when?

The ending diagonal is one of the elliot wave patterns that I so delight in.
It shows a large reversal in the prevailing trend or counter-trend. The joy of watching price breaking the lower trendline (in a bullish market) and the upper trendline (in a bearish market) is characteristically fast and overwhelming.

On 13th august, I posted an analysis on GbpJpy where the fall in mid-august and early september were so pronounced. The analysis is titled GbpJpy: When will the bears take over? . It's a must read.

Just as the forecast was done, price fulfilled all the conditions and fell sharply.

After the fall, I tried to wonder what drives the diagonals. I posted the analysis titled : What drive the diagonals? on 23rd august. You may want to read it also.

The chart below shows the price movement after the diagonal price formation.


The chart above shows that price is moving in a 3-wave corrective pattern after the motive wave that broke the diagonal downside. There could still be more room for the bears to ride the price.

The yellow region 188.80 and 190 (a confluence zone) is projected for price to complete the correction.

We could see price at this zone after which a crash will be expected.
Price is expected to be contained below 190 for any chance for the bears in the nearest time.


Get market analysis and signal to your phone number or E-mail address.

Just forward to forexmaster05@yahoo.com with the message title "signal"

AudNzd: A Technical Combination!

In the last update on Audnzd I used different technical analysis, headed by the elliot wave theory, to forecast a probable upward move.

There was a condition for a bullish opportunity.

Price could trace down a bit before rallying to break the upper trendline upside. This will be a trading opportunity to buy this pair with a good risk/reward ratio.

There could be a trading opportunity to ride wave C to 1.2175

Tuesday, November 10, 2015

Gbpchf: The Long Term View

From the monthly chart below, it can be seen that Gbpchf has declined in 3-waves from 2.7328 to 1.13825 in a move that lasted for more than a decade.
The move is expected to be an impulse wave.


The rally from 1.13825 (2011 low) is expected to be the 4th wave of the impulse. Price has tried many times to break above 1.5600, which has now become a strong resistance.

The 4th wave which began at 1.13825 (2011 low) is getting set to complete a flat corrective pattern.

Flat patterns, according to elliot wave theory, are 3,3,5 patterns; the first wave wave is corrective (3-wave), the second wave is also corrective (3-wave) while the terminating wave (5-wave) is a motive wave (impulse wave or ending diagonal).

The weekly chart below shows the internal/building waves of this 4th wave.


The terminal wave of the flat correction is completing an ending diagonal. The 5th wave of the diagonal will be expected to be a 3-wave as indicated in the chart below.


If price is contained below 1.5600 and breaks below the trendline connecting wave 2 and 4 of the diagonal, there will be an opportunity to put a long term sell order to ride to 1.38 and below.

Thursday, October 29, 2015

AudNzd: Upward Trend To Resume?

The bearish trend from 2011 was a clear impulse wave.

According to elliot wave theory, a 3-wave correction often follows a 5-wave trend. These corrections have different patterns; one of which is the zigzag pattern.

The 5-wave impulse in Audnzd ended and immediately started the 3-wave correction in April 2015.

Tuesday, October 27, 2015

Usdcad Taking One More Push Upside?

The price of Usdcad is predominantly determined by the crude oil markets. The negative correlation between them is so strong that as soon as oil price begins to fall, Usdcad immediately begins the rise in almost similar manner.

Since 2011, the trend of Usdcad has generally been bullish in what should be an impulse wave C of a cycle corrective ABC.

The C wave may have peaked at 1.3435 (100% fibonacci projection of wave A from B) but the impulse pattern doesn't look completed yet.

Price is probably in the 4th wave (a RUNNING FLAT corrective pattern shown in yellow) of the 5th wave of this impulse wave.

Thursday, October 8, 2015

GbpJpy To Continue Downward?

The fast fall in the GbpJpy had been forecast after a very powerful reversal pattern showed up- I call the pattern the 'pregnant diagonal' i.e a diagonal pattern ending a larger degree diagonal pattern. You can read the forecast  GBPJPY

And then read how price react later after the pattern completed GBPJPY

The fall was fast just as expected knowing that a diagonal is often followed by a fast counter move to its starting point.

Monday, October 5, 2015

Continuation Of Eurusd Bullish Correction. How probable?

It's been long that I haven't updated on this pair. The last analysis titled Eurusd Intraday Update was about how far price has reacted after the rise from 1.046.

Price from 1.046 is clearly engaging in a correction after a long term bearish move. The correction was expected to be a double zigzag pattern
Related Posts Plugin for WordPress, Blogger...