Tuesday, March 8, 2016

Gold: A New Triangle?

On 3rd March, we discussed about the triangle that formed the 5th wave of the expected impulse wave that broke out of the ending diagonal. You can read the article again here .

The impulse wave, which was expected to terminate between 1300 and 1400, is expected to be the first leg of a correction.

As price broke out of the 4th wave triangle, we expect price to rally in a real motive wave to the 1300-1400.


Presently price is consolidating in a side way movement after a short rally.
The chart below shows the Elliott wave analysis of the breakout rally


If price breaks above 1275.21, there will be a good position for price to rally to 1290-1300 in the nearest term.

Subscribe to this blog to alert you of good trading analysis, set ups and positions.

Thursday, March 3, 2016

Intraday Analysis; Cable to continue the bearish move.

Cable is expected to continue the downtrend which is projected to halt at 1.1740.
Price is about completing the 4th wave of the intra day trend and we may see further dip especially if price is contained below 1.4150 resistance.


If price is contained beneath the zone (1.41-1.415) and breaks below 1.404, we may see price dip to 1.372 which is the next projected support level.

Wednesday, March 2, 2016

Gold: Do We Have a Triangle?

Do you still remember the movement of Gold; the ending diagonal that signaled the end of the impulse wave from $1920?

Price was expected to break out of the diagonal with a corrective pattern starting with a 5-wave drive or a 3-wave.

We seem to be having the 5-wave drive as price broke out of the diagonal ferociously . The forming 5-wave signaled that corrective pattern we are expecting could be a zigzag pattern or its extension/variety.


The first leg potential 5-wave is about completing its 4th sub-wave with a clear contracting triangle. A break above this triangle upside could move price to 1300 or higher to 1400.

Nzdcad: The Long Term Correction Upside Is Not Over


The weekly chart above shows the activities of price from 0.6908 to 0.9675 and back to 0.8111. Price is in a long term bullish move. The rally is corrective and is projected to continue to 1.0861. Quite long...huh?

The projected corrective pattern is a double zigzag .

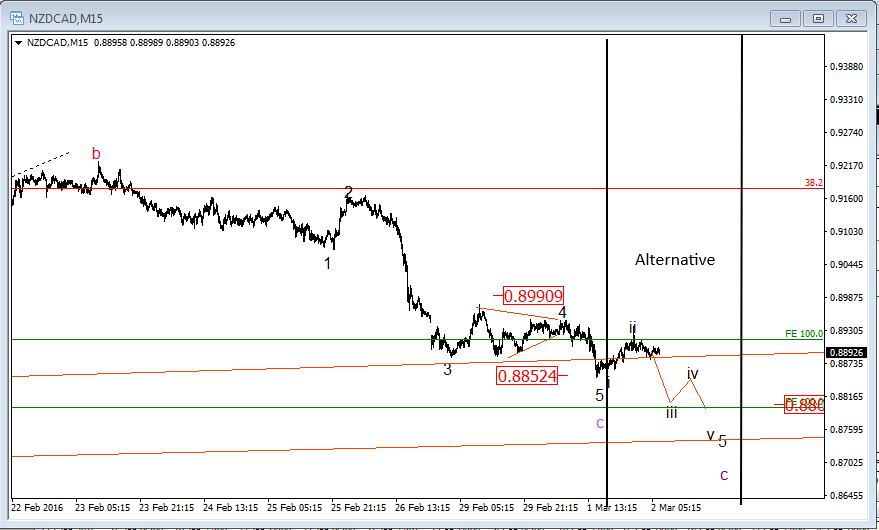
The recent dip in the 4hr chart below is a double zigzag correction which is projected to end at 0.8895-0.8750 before the rally continues.


If price advances and breaks above 0.899, there will be a good buying opportunity.

Price can alternatively, as shown in the 15min chart below, dip further to 0.88 regions and it will be good to look for buying signals


You can watch the video of this analysis below


Have you subscribed to my newsletter?. Sign up at the  right top corner to get market analysis and signals sent directly to your E-mail.

Friday, February 26, 2016

NzdJpy: Would these combined corrective patterns trigger a bearish move?

On 16th February, I did a video analysis pointing at a long term flat pattern emergence. See here .


The chart above was used in the analysis.

Price is projected to move in a motive wave and the first wave is still in motion, probably in the final phase i.e the fifth sub-wave.

With price projected to dip to the 70 price region with about 600 pips away and a motive wave, an impulse wave or an ending diagonal.

The video below explained further how price could move.


The second sub-wave of the fifth wave is complete and price is in motion to complete the third wave.

See the chart below


The chart above shows how the third wave of the 5th sub-wave is emerging. A combination of zigzag pattern followed by two different flat patterns shows that the recent intra day bullish drive will soon be exhausted for the bearish trend to continue in journey that could get to 70 price level.

The chart below shows the plan.


Subscribe to our mailing list to send the alert to you.

Tuesday, February 23, 2016

Gbpchf: 2 Emerging Patterns To Consider A Short

After the 5-Wave decline that broke out of the long term ending diagonal, we saw a shallow retracement which was resisted by the 4th wave of the 5-Wave drive at 1.4750.

Price dipped in a lower degree 5-wave impulse and has been congesting since 9th February.

If price does not dip below 1.3890, we might see a further intra day rally to 1.4310-1.4320 before the bearish trend resumes.

We have two projected scenarios in place; any of which,if satisfied, will make us look for a selling opportunity signal.

Scenario 1


Scenario 2


Watch the video below.


Thursday, February 18, 2016

Gold Intraday Triangle

Gold is presently in an intraday triangle pattern. If price breaks it down , we might see Gold selling at $1152.
Watch the following video

Tuesday, February 16, 2016

NzdJpy Forecast: Many opportunities abound

On the weekly chart, there is an emerging flat pattern which can make this pair drown in many years to come.
There are so good opportunities that are inherent.
Price is expected to continue the current dip till it retraces at a level shown in the video.

Watch the video and you may position yourself  for good profits.
If you want me to alert you, you can subscribe to my mailing list or ask for my signal service.


Monday, February 15, 2016

GbpJpy In a correction upside?...How to take advantage!

In the last video I released, I made an analysis of how I intended to sell GbpJpy. My sell entry was satisfied and I sent a message across to my subscribers to sell GbpJpy which gave us more than 800 Pips.

We are already out.

This is the new view . Watch the video below. If the forecast is satisfied, we will consider buying at the price mentioned


You can subscribe to our signal service or join our mailing list for accurate and high probability trade set-ups.

Wednesday, February 10, 2016

A Triangle In AudNzd: Bullish Expectation

The analytical chart below was posted on 16th December 2015 in the article titled AudNzd: What we expect next 


https://blogger.googleusercontent.com/img/b/R29vZ2xl/AVvXsEgBVx_uYvMW2YWWYxEylYD9aZZr1O54xVhbKbss3HqaPpeHErVMP2KX4iz062hvyLeibNFbg1GHvLsN2q9aGu10OAvW0omy8tw5SFVn905NdV88xi645evh4piahruayZspf4_gePTB1R4/s1600/Audyen+dec...weekly.png

It was so clear to us that price was in a corrective rally after a 5-wave impulse fall off. We also had  an inverted head and shoulder pattern in line. We though that if price rallied to 1.4526 as expected in the manner highlighted, it will further show how other technical systems are engulfed by and subsumed in Elliott wave theory. Elliott wave theory caps them all in a 'big brotherly' manner.

The expected rally was expected to be a 5-wave motive move in what should break above 1.14526 (the neckline of the inverted head and shoulder) and Elliott pattern traders would have been making god pips before chart pattern traders get a confirmation from the breakout.

In the same article, we posted the chart below to track the Intra day Elliott wave pattern that would trigger the bullish ride.


We saw a tripple zigzag pattern and made this proposition
If price is contained above 1.05 and rallied to break above 1.077, we will be prepared to get in line with a long position aiming 1.1548 as the final future price level.
That was the condition to consider a buy trade.

Price never rallied toward 1.077 but rather dips below 1.05 and thereby stretched the tripple zigzag. We dropped it since then and decided to take it back when it is clear what corrective pattern will emerge to drive price up.

We seem to find it in the chart below : A triangle pattern.


The chart above shows that the correction we are seeking for could be a triangle pattern. Triangle pattern often occur at the 4th wave of a motive wave and the b-leg of a corrective wave.

We expect price to be contained above 1.051; a rally from the present level to break the triangle upside should trigger a buying trading opportunity to 1.22 which is an important level.

Don't forget to be part of our mailing list or subscribe to any of our services.

Monday, February 8, 2016

What Did You Do With The Gold Rally?

On 21st December 2015, we forecast a rally after an ending diagonal formation which terminated the impulse bearish move since 2011.

Read the analysis HERE

We expect price to go higher.

Watch the video below
Related Posts Plugin for WordPress, Blogger...