Wednesday, April 30, 2014

EurNzd bearish move forecast

This pair has been moving downward with style from January with up swings in between.


It looks, presently,like price could be rejected at 1.62s after a strong resistance was formed there.


The expected bearish move form this level could drive the market to 1.56s


Get my feel from the chart below


Please let me know if this blog has been helping someone by your comments  and you can also contact me if you need a trading partner,mentor or fund manager
e-mail-sanmiadeagbo@yahoo.com
Facebook- sanmi Adeagbo
twitter- Forexelyte
Phone no: (234)08134820569

Monday, April 28, 2014

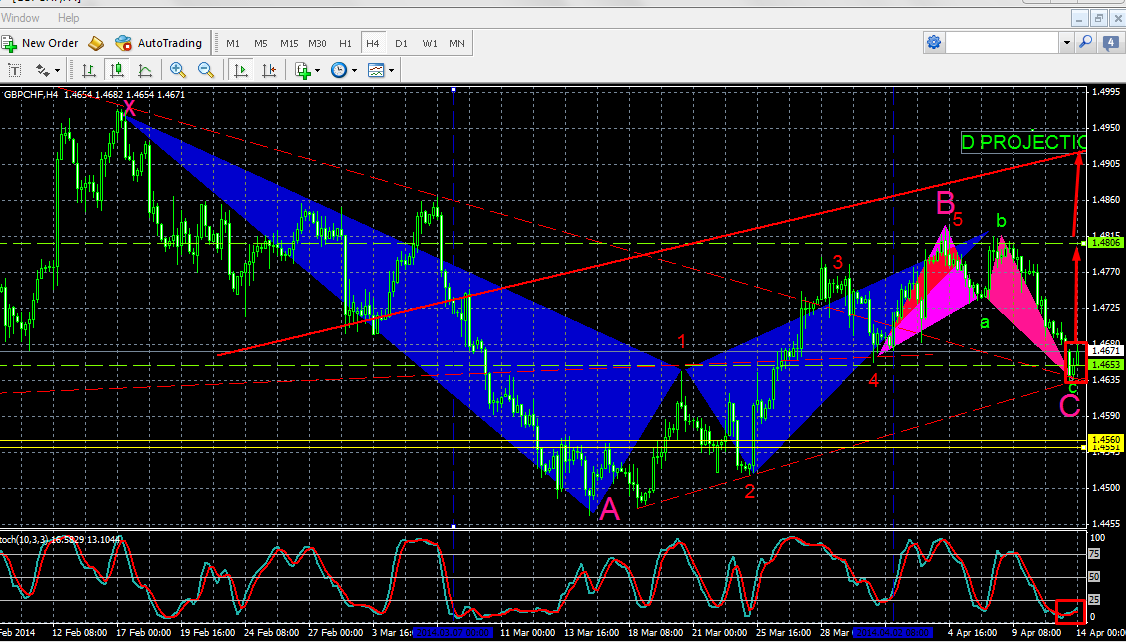
Gbpchf Analysis for the last week of April

Wow!...What more can I say on this pair?. Consistently for more than two months, I have been able to follow this pair and predict its movement almost perfectly


I predicted a level for bearish run last week and Gchf moved down significantly from that level and presently, I am on 90pips plus. I will hold my sell till am convinced not to do so after taking profits at two different levels of the recent bearish correction move.


I see this move as a correction move which could still extend to 1.4725-1.4745 before the bullish move continues. Should this pair reach this level and bounce off....we should be ready for a big bullish move to 1.4900 and beyond.


With the analytical chart below, someone might have a clearer picture.


Please let me know if this blog has been helping someone by your comments  and you can also contact me if you need a trading partner,mentor or fund manager
e-mail-sanmiadeagbo@yahoo.com
Facebook- sanmi Adeagbo
twitter- Forexelyte
Phone no: (234)08134820569


Tuesday, April 22, 2014

Is UJ set for the bearish continuation move?

UsdJpy could be set for a new bearish adventure...Check the analytical chart below


Monday, April 21, 2014

GbdAud weekly analysis 21st-25th April

A head and shoulder which started on November last year was broken last month.


Presently,for almost 1 week, price has been trying to retest the neckline of this head and shoulder.


I'm also expecing wave 4 to be formed at this neckline before a new bearish takes off to hit 1.7490 where the bullish trend should continue.


I will watch price bearish signal at the neckline and ride to 1.7490 if the market gives me its back before I look forward to fly up again.


Many parameters are converging at 1.7490 which makes it a magnetic zone for price.


A picture speaks louder than a thousand words....what about 2 Pictures?


To learn about how I trade/ If you need a forex mentor/partner or a fund manager, call me (234)08134820569 or mail me @ sanmiadeagbo@yahoo.com

Gbpchf analysis 21st-25th April 2014

If you have been following me, you would have discovered how I have almost perfectly followed this pair. 


On 13th April, I predicted a bullish run high up and provided a possible reversal zone signalling end of wave 5 and successful formation of a gartley pattern....


Now this level is approaching and am just right there in advance looking for price action around 1.4860-1.4885 before paddling my boat to start a fresh bearish journey. 


You could also watch this level


A picture speaks louder than a thousand words, check the analytical chart below. 


To learn about how I trade/ If you need a forex mentor/partner or a fund manager, call me (234)08134820569 or mail me @ sanmiadeagbo@yahoo.com


Eur/Usd Analysis for 21st to 25th April 2014

This pair started the bearish mid-term run on 11th April and retraced upward 3days after to prepare for more bearish run.


The trend outlook is still bullish and if the bearish mid-term run should continue, I expect it to end at 1.3735 which is a nice reversal zone from elliot wave and harmonic pattern point of view at a strong support level..


I will wait to buy at the indicated zone/level if I see a bullish signal.


A picture speaks more than a thousand words, check my analytical chart below.


To learn about how I trade/ If you need a forex mentor/partner or a fund manager, call me (234)08134820569 or mail me @ sanmiadeagbo@yahoo.com

Thursday, April 17, 2014

GbpUsd ABC bearish correction?

I expect an ABC bearish correction on this pair...This pair has given me 220 pips since last week.


I see a deep cab pattern has formed already, so I expect market reaction to be bearish. 


A picture speaks louder than a thousand words. Check the chart below


The wave 5 could be completed because of the following parameters:


1. 1.618 fibo extension of wave 1 from wave 2


2. 1.13 deep retracement of the prior downward move thereby forming a deep crab pattern


3. A resistance trendline


4. A pin bar forming on the daily chart


I expect this bearish move (if it happens) to be an ABC correction which could go deep to 50% ret (at 1.6700), 61.8%ret (at 1.6650) or 1.6600 ofthe upward move from 1.6460.

Sunday, April 13, 2014

Why i will consider buying Gbpchf this week

Picture , they say, speaks louder than a thousand words...check the chart below for how I analysed Gbpchf


Thursday, April 10, 2014

What do you think of UsdCad? A bullish retracement?

I see UsdCad retracing to 1.1010 befor a possible bearish continuation if the bear doesnt take over


GbpUsd might decline to resume another bullish BOOM

This pair is clearly trending up. According to my analysis, we might have a dip at any of these levels for a significant bearish retracement
1. 1.6820
2. 1.6885
3. 1.702-3
Presently, the cable is forming the possible retracement at 1.6820 to further push up to 1.702 and I would trade it if the momentum is well trending.

1.667-8 could be a realistic target if this is a real corrective reversal to push up to 1.702 as I earlier mentioned.

 The analytical chart below showed my parameters @ 1.6820


Tuesday, April 1, 2014

UsdJpy could form a dip!

This market is still in a very strong Uptrend and it's still maintaining it.
Presently we see a falling triangle formed on daily time frame which if broken could send this pair up significantly.


Price is presently at the top of the afformentioned triangle and with the harmonic pattern formed at a falling trendline in H4, we could have a dip to 101.5 before the bullish trend resumes


If i see a bearish engulfing bar on H4, i will sell this pair and expect to ride to 101.60 before thinking where this market would go.


Sunday, March 30, 2014

Gbpchf to resume the bearish trend?

This pair really gave me a lot in the past two weeks. I have been buying at different positions and made more than 250 pips. But I see the recent bullish move could be a mere correction of the bearish trend we've been having.

I think it could be time for the bearish trend to resume, and if it is ready to resume, we could be in for mouth watering galore of PIPS

This is why i think the bearish could resume
1. the 4H has formed a bearsish gartley at a strong bearish trend line
2. the bearish formation is accompanied with a bearish candlestick formation
3. the momentum indicator on 4H is overbought and trending down while on D1 is overbought too but not trending down yet


If this pair will trend down as predicted, we should be expecting an initial movement to 1.4630 where we could see a buy signal to push up.

 If there is no sign of the bulls then price could drive down  below 1.4500 and then to 1.4400
Good luck to you all


If this analysis has been helping someone, pls drop a comment.Thank you

Tuesday, March 25, 2014

Sunday, March 23, 2014

I expect GbpChf Bullish Run to Coninue


After raking about 100 pips from trading the bullish gartley harmonic pattern I earlier mentioned. The pattern is still intact, though undergoing a minor retracement due to the formation of a pin bar.

I still maintain a bullish bias looking at the 4H chart below, the 4th Elliot wave could end @ 1.4555 to resume a fresh bullish move (wave 5) to 1.4690-1.4700       (confluence of strong resistance and 50%-61.8% retracement of the bearish run which started on 5th march)


AUDCHF Weekly Outlook


This pair looks like forming a good formation, rising from a bounce off the established upward trendline after a bullish candles formation.

The price is heading toward strong resistance @ 0.8045.

A bearish candles formation off this level could create a bounce and price gets bearish to 0.7900 or lower.

If price breaks 0.8045 upward, the next visible level is 0.8175 .If price turns back before 0.8175, we could have a bearish harmonic set-up


Wednesday, March 19, 2014

4 reasons why Gbpchf could be bullish

I have been watching this pair for some time and I think it has fulfilled my 'righteousness' enough to consider for a buy.Here are my reasons
1. A successful bullish gartley pattern formed

2. Pattern confirmed by an engulfing candles formation which also contain a bullish reversal pin bar, though the day is still open

3.The gartley formed at a reversal trendline support region

4. The oscillator trending up from an oversold region

These are more than enough reasons to consider a buy, though 1.4640 could act as a barrier.  

consolidation could happen there before the price move to 1.4850 which is the ultimate target


4 Reasons for selling EurGbp tomorrow

Check this pair out and see four reasons one might consider to sell this pair

1. Successful bearish butterfly pattern formed

2. Pattern confirmed by a bearish candlestick ( provided it's maintained till the end of today's candle

3. Pattern and bearish candle formed at a strong resistance level ( 1.8390)

4. Momentum indicator at overbought region.......

If today's candle engulfs yesterday's candle..I will definitely open a sell order 


Friday, March 7, 2014

EURNZD FORMING BULLISH

From September last year till now, this pair has been ranging. After forming a resistance at 1.6675, it moved down steadily to retest 1.6255 with a pin bar candle. 

I expect a movement up from there to 1.6465 and 1.6600 which are going to be my targets with my stop loss below the pin bar. 

Price could dip lower with about 30-45 pips before the predicted move. As usual my buy limit will be at 1.6285


Trade with low risk and high profit. Get forex education videos


Tuesday, March 4, 2014

EurUsd bearish?

This pair was on an irregular trendy bearish wave pattern from mid-December 2013 to late January and early February this year before it commenced on a sweet bullish run to 1.377s and it remained there to form a resistance. It broke this level on Friday 28th February with a long bullish candle to retest the 1.38 - 1.381 resistance formed on December 2013

We have seen this week, so far, how price reversed below this level and formed an inside bar and pin bar set ups.


I expect price to retest 1.3755-1.3770 or a little bit more before it starts the bearish reversal to 1.366s-77s and the stop loss could be above the middle candle.This scenerio will be invalid if price returns to 1.38100 with a high momentum.


Learn how to trade price action and spend  2 hours daily

Eurcad bearish formed

This pair looks good to my eyes with beautiful swinging patterns forming, which started on August 2012 (Zoom back your platform to view). A fall could be imminent ( at least at the short term).


The wave that formed from early January this year formed a bearish reversal candles pattern  at (1.5315-1.5320) , and tested 1.4970-80 briefly before resuming the swing upward to retest (1.5315-20) level.


The formation of a pin bar reversal candle at this level could force this pair to form a double top and drag it back to (1.4970-80) level and if broken could see it going down to 1.4426


On the other side, if the afformentioned pin bar is broken upside with a high momentum, we could see a bullish wave resumption to 1.6 levels.At the moment, I see this pair retesting 1.528s before moving toward 1.497s with stop loss a little pips above the pin bar. 

Trade at your own risk. 

Order  for my trading materials and trade price action spending 1-2 hours daily or mail me @ sanmiadeagbo@yahoo.com 

Related Posts Plugin for WordPress, Blogger...