Wednesday, May 21, 2014

Now EurAud is saying something!

This pair, in the recent months, has been moving southward with beautiful wavy patterns. I don't think it is ready to stop doing that despite the recent upward push.


Going by my wave count, wave 4 has completed and a move to the region of 1.4560 suggests that wave 5 is ruling. With the recent up-push, it appeared that wave 5 could be through. But a proper look suggests that wave 5 has not reached its minimum projection level.


Presently, we see this pair resting on a very strong resistance ( with the convergence of 4 parameters) after an ABC-61.8% harmonic reversal pattern successfully formed ( at least potentially) on H4. This suggest that wave 5 has not completed yet and a strong move is now expected downward to 1.4560 and 1.4140 ( for the stretched term).


I am expecting a candlestick bearish pattern on H4 and some other parameters to align  and then sell this pair expecting large move.


Please let me know if this blog has been helping someone by your comments  and you can also contact me if you need a trading partner,mentor or fund manager

E-mail-sanmiadeagbo@yahoo.com Facebook- sanmi Adeagbotwitter- ForexelytePhone no: (234)08134820569


Friday, May 16, 2014

The Bears may not be done with GbpAud yet.

On 4th May, I forecast a bearish move of this pair and the move was just right. I hit my secong target with 350pips and the last part of my trade was stopped at +235pips. Not a bad result at all.


The downward move was quick and massive, broken the first trendline (in magenta colour). 

At the moment of typing this information, price retraced fast to retest this trendline and a sumptuous pin was formed on 4H and 1H with a Gartley ABC correction of the last bearish move.


I will sell from here and hope I can take my full target at 1.7500 but I will take profits along the way and ride with the trend if market decides to move this way.


Please let me know if this blog has been helping someone by your comments  and you can also contact me if you need a trading partner,mentor, fund manager  or  Get 1 year free signal and trade what I tradee-mail-sanmiadeagbo@yahoo.comFacebook- sanmi Adeagbotwitter- ForexelytePhone no: (234)08134820569


Thursday, May 15, 2014

UsdChf not ready to break the channel

I can't remember the last time I traded this pair but I won't overlook the set-up it's forming at the moment.

This pair has been in a bearish channel since october 2013 and it's not broken yet.

Presently, after a flat correction pattern formed, we could see this pair continuing the bearish trend and probably break out of it.


Looking at the daily chart closely, a pin bar reversal candlestick bearish pattern has just been formed at a very critical level. Markets rarely ignore this kind of set-up. I will look to ride this pair downward. I hope I can enjoy it


OPEN A LIVE ACCOUNT WITH MY PARTNER BROKER AND ENJOY 60% BONUS, I YEAR FREE SIGNAL AND MENTORSHIP


UPDATE ON AUDNZD

Seriously,this pair is looking so good to me with elliot waves and swing patterns forming into place. After having a ride up with beautiful pips, I predicted a dip on 8th May, you can read here


Though I didn't trade this dip and those that traded should be enjoying their trades now if their stop loss was not too close. They still have the opportunity to ride to 1.074 or thereabout for minimum of 80pips (that isn't bad at all).


But I see a new buy interest at the level 1.076 -1.073 and a great bull ride should continue from there. This zone is very magnetic with a potential deep ABC correction/bat pattern.


I will watch out for price action at this level and anticipate a bullish set up with my entry strategy. You can also watch out for this level.


Get the feel with the analytical chart below


Please let me know if this blog has been helping someone by your comments  and you can also contact me if you need a trading partner,mentor or fund manager
Get 1 year free signal and trade what I trade


Facebook- sanmi Adeagbo
twitter- Forexelyte


GbpUsd Bullish set-up

After a long bullish move from March, this pair is forming a dip. This could be the second bearish retracement ( i.e wave 4) of this bullish trend.


This bearish dip looks exhausted and it's just a matter of time that the bullish move continues.


With reversal zone, formed by the confluence of various fibonacci extension and retracement drawn from key levels, at 1.6560-1.6700; we could be in for the end of wave 4 ( which shouln't dip into the wave 1 region below 1.6700) and the resumption of wave 5 which should close above the top of wave 3.


I will watch for bull signal at this zone for a long trend to the upside and if this should happen..woow! that will be a party of pips.


If a reversal signal is not formed at this level and price breaks through with a high momentum, this scenerio will be invalid and I will look at somewhere else


Please let me know if this blog has been helping someone by your comments  and you can also contact me if you need a trading partner,mentor or fund manager
Get 1 year free signal and trade what I trade
e-mail-sanmiadeagbo@yahoo.com
Facebook- sanmi Adeagbo
twitter- Forexelyte
Phone no: (234)08134820569


Friday, May 9, 2014

AudNzd renewed Interest

Woow!..What a wonderful experience I had with this pair over tha last two weeks. A whooping 300pips in less than two weeks is not bad, Is it?.

I highlighted a particular zone for reversal on Monday and predicted two possible scenerios (read here) and price reversed just right there to fulfil the second scenerio. The bias now ( at the moment,based on the present data) is bullish.


After that upward move, price appears to have formed a bearish correction pattern which could end between (1.0760 and 1.0730) after which the bull continues its movement.


If the afformentioned level is broken on a high momentum, the bears could resume and second scenerio will be violated and invalid. At the moment, the 2nd scenerio is still in control until price movement proves otherwise.


If you are a short term/intraday trader, you might look at selling to the zone but medium-term guys could wait for a renewed buy signal at the level (well if the market agrees with us)


Please let me know if this blog has been helping someone by your comments  and you can also contact me if you need a trading partner,mentor or fund manager
e-mail-sanmiadeagbo@yahoo.com
Facebook- sanmi Adeagbo
twitter- Forexelyte
Phone no: (234)08134820569


OPEN A LIVE ACCOUNT WITH MY PARTNER BROKER AND ENJOY 60% BONUS, 1 YEAR FREE SIGNAL AND MENTORSHIP


Monday, May 5, 2014

AudNzd Forecast and Analysis

I cashed out 150pips from the current bearish move of this pair ( It was a fast trade that I enjoyed; I didn't put the analysis here. It was a fast trade that I shared with few of my friends). This pair looks promising to trade because of the swings and high magnetic zone it's formed.


While I will admit that the overall trend, at least based on the present data, is bearish; I still believe that this market could swing up. I have two scenarios


Ist Possible Scenerio:

The recent ABC correction of the 5-wave bullish move is weakening and a bullish run could emerge from 1.0610 to 1.0650 which is a very strong support level from trendline analysis and fibonacci harmonic point of view.


If this level will hold, we could see market fly really high above 1.0900 provided the recent bearish move is a correction and that will be a whole lot of pips in the bag


2nd Possible Scenerio:

The recent bearish move could be a call for the bearish trend to continue and expected bullish move at 1.0610-1.0650 zone could just be a correction ( Wave 4) which could end at 1.0750 and its neighbourhood and surge the bearish run further and if the old wave 1 is broken down....BOOM, the bearish trend continues and AudNzd deepens


I will watch for price action at these levels especially the zone discussed


Please let me know if this blog has been helping someone by your comments  and you can also contact me if you need a trading partner,mentor or fund manager
e-mail-sanmiadeagbo@yahoo.com
Facebook- sanmi Adeagbo
twitter- Forexelyte
Phone no: (234)08134820569


Open a Live account with my partner broker and enjoy 60% bomus, 1 year free mentorship and free signals


Sunday, May 4, 2014

GbpAud bearish signal.

I predicted an upward move of this pair on 21st April before I concluded on a region ( read it here) where I would consider selling.


This level has been reached bearly two weeks after and I have discovered a sell signal to ride this pair to 1.7490 at the minimum.


I will be trading the end of wave 4 ( head and shoulder neckline retest) and the beginning of wave 5 which I expect to break the rising trendline.


If the rising trendline holds this pair, the bullish move could continue.


As we anticipate and perhaps trade the prospective bearish movement, we should keep an eye on the rising trendline and observe how price react to it.


Please let me know if this blog has been helping someone by your comments  and you can also contact me if you need a trading partner,mentor or fund manager
e-mail-sanmiadeagbo@yahoo.com
Facebook- sanmi Adeagbo
twitter- Forexelyte
Phone no: (234)08134820569


Wednesday, April 30, 2014

EurNzd bearish move forecast

This pair has been moving downward with style from January with up swings in between.


It looks, presently,like price could be rejected at 1.62s after a strong resistance was formed there.


The expected bearish move form this level could drive the market to 1.56s


Get my feel from the chart below


Please let me know if this blog has been helping someone by your comments  and you can also contact me if you need a trading partner,mentor or fund manager
e-mail-sanmiadeagbo@yahoo.com
Facebook- sanmi Adeagbo
twitter- Forexelyte
Phone no: (234)08134820569

Monday, April 28, 2014

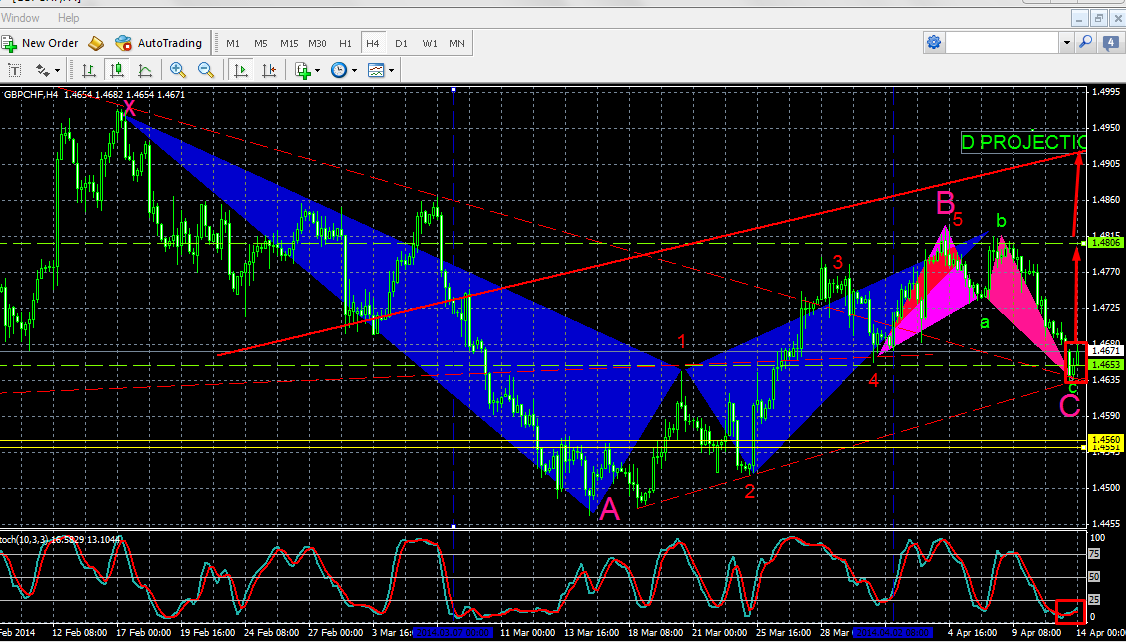
Gbpchf Analysis for the last week of April

Wow!...What more can I say on this pair?. Consistently for more than two months, I have been able to follow this pair and predict its movement almost perfectly


I predicted a level for bearish run last week and Gchf moved down significantly from that level and presently, I am on 90pips plus. I will hold my sell till am convinced not to do so after taking profits at two different levels of the recent bearish correction move.


I see this move as a correction move which could still extend to 1.4725-1.4745 before the bullish move continues. Should this pair reach this level and bounce off....we should be ready for a big bullish move to 1.4900 and beyond.


With the analytical chart below, someone might have a clearer picture.


Please let me know if this blog has been helping someone by your comments  and you can also contact me if you need a trading partner,mentor or fund manager
e-mail-sanmiadeagbo@yahoo.com
Facebook- sanmi Adeagbo
twitter- Forexelyte
Phone no: (234)08134820569


Tuesday, April 22, 2014

Monday, April 21, 2014

GbdAud weekly analysis 21st-25th April

A head and shoulder which started on November last year was broken last month.


Presently,for almost 1 week, price has been trying to retest the neckline of this head and shoulder.


I'm also expecing wave 4 to be formed at this neckline before a new bearish takes off to hit 1.7490 where the bullish trend should continue.


I will watch price bearish signal at the neckline and ride to 1.7490 if the market gives me its back before I look forward to fly up again.


Many parameters are converging at 1.7490 which makes it a magnetic zone for price.


A picture speaks louder than a thousand words....what about 2 Pictures?


To learn about how I trade/ If you need a forex mentor/partner or a fund manager, call me (234)08134820569 or mail me @ sanmiadeagbo@yahoo.com

Gbpchf analysis 21st-25th April 2014

If you have been following me, you would have discovered how I have almost perfectly followed this pair. 


On 13th April, I predicted a bullish run high up and provided a possible reversal zone signalling end of wave 5 and successful formation of a gartley pattern....


Now this level is approaching and am just right there in advance looking for price action around 1.4860-1.4885 before paddling my boat to start a fresh bearish journey. 


You could also watch this level


A picture speaks louder than a thousand words, check the analytical chart below. 


To learn about how I trade/ If you need a forex mentor/partner or a fund manager, call me (234)08134820569 or mail me @ sanmiadeagbo@yahoo.com


Eur/Usd Analysis for 21st to 25th April 2014

This pair started the bearish mid-term run on 11th April and retraced upward 3days after to prepare for more bearish run.


The trend outlook is still bullish and if the bearish mid-term run should continue, I expect it to end at 1.3735 which is a nice reversal zone from elliot wave and harmonic pattern point of view at a strong support level..


I will wait to buy at the indicated zone/level if I see a bullish signal.


A picture speaks more than a thousand words, check my analytical chart below.


To learn about how I trade/ If you need a forex mentor/partner or a fund manager, call me (234)08134820569 or mail me @ sanmiadeagbo@yahoo.com

Thursday, April 17, 2014

GbpUsd ABC bearish correction?

I expect an ABC bearish correction on this pair...This pair has given me 220 pips since last week.


I see a deep cab pattern has formed already, so I expect market reaction to be bearish. 


A picture speaks louder than a thousand words. Check the chart below


The wave 5 could be completed because of the following parameters:


1. 1.618 fibo extension of wave 1 from wave 2


2. 1.13 deep retracement of the prior downward move thereby forming a deep crab pattern


3. A resistance trendline


4. A pin bar forming on the daily chart


I expect this bearish move (if it happens) to be an ABC correction which could go deep to 50% ret (at 1.6700), 61.8%ret (at 1.6650) or 1.6600 ofthe upward move from 1.6460.

Sunday, April 13, 2014

Why i will consider buying Gbpchf this week

Picture , they say, speaks louder than a thousand words...check the chart below for how I analysed Gbpchf


Thursday, April 10, 2014

What do you think of UsdCad? A bullish retracement?

I see UsdCad retracing to 1.1010 befor a possible bearish continuation if the bear doesnt take over


GbpUsd might decline to resume another bullish BOOM

This pair is clearly trending up. According to my analysis, we might have a dip at any of these levels for a significant bearish retracement
1. 1.6820
2. 1.6885
3. 1.702-3
Presently, the cable is forming the possible retracement at 1.6820 to further push up to 1.702 and I would trade it if the momentum is well trending.

1.667-8 could be a realistic target if this is a real corrective reversal to push up to 1.702 as I earlier mentioned.

 The analytical chart below showed my parameters @ 1.6820


Tuesday, April 1, 2014

UsdJpy could form a dip!

This market is still in a very strong Uptrend and it's still maintaining it.
Presently we see a falling triangle formed on daily time frame which if broken could send this pair up significantly.


Price is presently at the top of the afformentioned triangle and with the harmonic pattern formed at a falling trendline in H4, we could have a dip to 101.5 before the bullish trend resumes


If i see a bearish engulfing bar on H4, i will sell this pair and expect to ride to 101.60 before thinking where this market would go.


Sunday, March 30, 2014

Gbpchf to resume the bearish trend?

This pair really gave me a lot in the past two weeks. I have been buying at different positions and made more than 250 pips. But I see the recent bullish move could be a mere correction of the bearish trend we've been having.

I think it could be time for the bearish trend to resume, and if it is ready to resume, we could be in for mouth watering galore of PIPS

This is why i think the bearish could resume
1. the 4H has formed a bearsish gartley at a strong bearish trend line
2. the bearish formation is accompanied with a bearish candlestick formation
3. the momentum indicator on 4H is overbought and trending down while on D1 is overbought too but not trending down yet


If this pair will trend down as predicted, we should be expecting an initial movement to 1.4630 where we could see a buy signal to push up.

 If there is no sign of the bulls then price could drive down  below 1.4500 and then to 1.4400
Good luck to you all


If this analysis has been helping someone, pls drop a comment.Thank you

Tuesday, March 25, 2014

Sunday, March 23, 2014

I expect GbpChf Bullish Run to Coninue


After raking about 100 pips from trading the bullish gartley harmonic pattern I earlier mentioned. The pattern is still intact, though undergoing a minor retracement due to the formation of a pin bar.

I still maintain a bullish bias looking at the 4H chart below, the 4th Elliot wave could end @ 1.4555 to resume a fresh bullish move (wave 5) to 1.4690-1.4700       (confluence of strong resistance and 50%-61.8% retracement of the bearish run which started on 5th march)


AUDCHF Weekly Outlook


This pair looks like forming a good formation, rising from a bounce off the established upward trendline after a bullish candles formation.

The price is heading toward strong resistance @ 0.8045.

A bearish candles formation off this level could create a bounce and price gets bearish to 0.7900 or lower.

If price breaks 0.8045 upward, the next visible level is 0.8175 .If price turns back before 0.8175, we could have a bearish harmonic set-up


Wednesday, March 19, 2014

4 reasons why Gbpchf could be bullish

I have been watching this pair for some time and I think it has fulfilled my 'righteousness' enough to consider for a buy.Here are my reasons
1. A successful bullish gartley pattern formed

2. Pattern confirmed by an engulfing candles formation which also contain a bullish reversal pin bar, though the day is still open

3.The gartley formed at a reversal trendline support region

4. The oscillator trending up from an oversold region

These are more than enough reasons to consider a buy, though 1.4640 could act as a barrier.  

consolidation could happen there before the price move to 1.4850 which is the ultimate target


4 Reasons for selling EurGbp tomorrow

Check this pair out and see four reasons one might consider to sell this pair

1. Successful bearish butterfly pattern formed

2. Pattern confirmed by a bearish candlestick ( provided it's maintained till the end of today's candle

3. Pattern and bearish candle formed at a strong resistance level ( 1.8390)

4. Momentum indicator at overbought region.......

If today's candle engulfs yesterday's candle..I will definitely open a sell order 


Friday, March 7, 2014

EURNZD FORMING BULLISH

From September last year till now, this pair has been ranging. After forming a resistance at 1.6675, it moved down steadily to retest 1.6255 with a pin bar candle. 

I expect a movement up from there to 1.6465 and 1.6600 which are going to be my targets with my stop loss below the pin bar. 

Price could dip lower with about 30-45 pips before the predicted move. As usual my buy limit will be at 1.6285


Trade with low risk and high profit. Get forex education videos


Tuesday, March 4, 2014

EurUsd bearish?

This pair was on an irregular trendy bearish wave pattern from mid-December 2013 to late January and early February this year before it commenced on a sweet bullish run to 1.377s and it remained there to form a resistance. It broke this level on Friday 28th February with a long bullish candle to retest the 1.38 - 1.381 resistance formed on December 2013

We have seen this week, so far, how price reversed below this level and formed an inside bar and pin bar set ups.


I expect price to retest 1.3755-1.3770 or a little bit more before it starts the bearish reversal to 1.366s-77s and the stop loss could be above the middle candle.This scenerio will be invalid if price returns to 1.38100 with a high momentum.


Learn how to trade price action and spend  2 hours daily

Eurcad bearish formed

This pair looks good to my eyes with beautiful swinging patterns forming, which started on August 2012 (Zoom back your platform to view). A fall could be imminent ( at least at the short term).


The wave that formed from early January this year formed a bearish reversal candles pattern  at (1.5315-1.5320) , and tested 1.4970-80 briefly before resuming the swing upward to retest (1.5315-20) level.


The formation of a pin bar reversal candle at this level could force this pair to form a double top and drag it back to (1.4970-80) level and if broken could see it going down to 1.4426


On the other side, if the afformentioned pin bar is broken upside with a high momentum, we could see a bullish wave resumption to 1.6 levels.At the moment, I see this pair retesting 1.528s before moving toward 1.497s with stop loss a little pips above the pin bar. 

Trade at your own risk. 

Order  for my trading materials and trade price action spending 1-2 hours daily or mail me @ sanmiadeagbo@yahoo.com 

Friday, February 21, 2014

Audchf bullish outlook

The long bearish trend of this market, which we see, has entered into a range between 0,8170 and 0.7725.


The latest counter trend bullish move from 0.7725 was rejected  at 0.8170 with a pin bar, and price has since continued the bearish move and it's percieved to halt by a pin bar at 0.7960 ( which is a strong level considering the number of times it has been broken and retested )


This pair could continue its counter-trend bullish move toward 0.8170 and this scenerio becomes invalid if price, today or tomorrow, breaks the pin bar downside with a great deal of momentum


At the moment, there is a bullish bias in the nearest term


Eur Aud bearish outlook

After a strong bearish move from 1.5770 which started on 24th January of this year, breaking 1.5300 with high momentum and finally reversed with a bullish engulfing caldlestick formation at 1.5020.


The reversal started on 12th of February back to retesting 1.5300 ( a support terned resistance ) with a pin bar bearish reversal candlestick formation.


I expect a reversal from here with retracement to 1.5280 before the bearish movement starts. 

The target should be close to 1.5020 which should welcome price before it determines its next move. The stop loss will be about 5-10 pips above the pin bar.


This scenerio will become invalide if price broke the pin bar today or tomorrow with a high momentum to break 1.5300 upside to face 1.5550 and finally 1.5770, but this will take some time


Trade with caution and maintain proper management

Thursday, February 13, 2014

AudUsd and Audchf bearish signal

Due to my analysis yesterday about these two pairs
I will be going for a sell at a little reversal
Please check my previous posts about these pairs


GET HECTOR DEVILLE FOREX COURSE IN NIGERIA

I have been a forex trader for a while. There were times when I solely depend on indicators, you need to see how heavy my chart was. I was confused day-by-day and I changed from one strategy to the other. No concistent result, instead I wasted a few accounts. I was frustrated and took a time from forex. I thought it wasn't real and those claiming to be successful were scammers.


I started learning price action trading systems and I began to see the mind of great traders, why they trade what they trade. I began to recognise levels to watch out for. I learnt how the market react to these levels


It was then I realised forex market is a very organised market. You need to be well harmed to be successfulI proceeded to learning how and where to place stop loss and target profits; how to exit a loosing trade; profit and loss management; risk/reward ratio and how to accumulate profits.


If you are reading this, and you have been in my shoes or are in it presently, you will understand how frustrating forex can be


I had a breakthrough when I subscibed to a course online anchored by a man called Hector Deville.Hector is not only a profitable full-time trader but a good trainer too. This course contained a lot of videos and discussed about 5 different powerful and highly profitable simple systems.


I learnt why market react the way they do, what to expect from the market, how to snipe it and come out profitably more times with a risk reward ratio of 1:2 at least. I learnt how to keep a trading journal, how to manage risk, how to manage my profits and how to manage my losses ( many don't understand this).


I studied this course very well and I chose one strategy out of this five, modified it to suit me, and that is the basis of my analysis on this blog.I have traded actively with this strategy and make an average of 850pips on a monthly basis trading 1-2 hours daily. I have a job I keep, I trade forex part-time and I still trade very profitably.
Perhaps, when I decide to trade full time, I will incorporate other strategies discussed in the course
For people who want to learn profitable forex systems that experts and profitable traders use, here we go....Let me take you through Hector Deville course.


 First, Hector explains the theory behind all his strategies: how they work, why they work, what principles they are based on, what to do in order to trade them and how to do it. It is important that you understand the reasoning behind a system so you can take your trading decisions with the full awareness of what's going on behind the curtains, he walks you through the method step by step, so you can follow him all the way along the video presentation.


Then he shows you a video where he applied that same trading strategy in a live trade recorded in real time! You will see absolutely everything: entry levels, stop loss, exit levels, potential risks of the trade, partial exit levels, etc. As the trade unfolds in real time, he explains how he manages the trade and the logics behind taking this or that trading decision. Literally, it's as if you were watching him trade live over his shoulders as he "comments" on the trade all the way through! 

Let’s face it!Whether you are new to forex or you’ve been trading forex before, you need to sustain consistent profitability.


The 3 SMA Trend-Riding StrategyThis strategy is essentially what was taught in Hector’s original Hector Trader course. It uses 3 simple moving averages to define dynamic areas of support and resistance, which when combined with a good trend gives you extremely accurate entries in the direction of the trend.                                                                      This strategy is easy to learn, and it works on virtually all timeframes and currencies.The 3SMA Trading System consists of 21videos, 6:46hrs, and it is Swing trading in its purest form and allows you to trade all 28 currency pairs with a wide range to choose from

The London Open Breakout SystemIn this module Hector teaches a price action based breakout strategy, not the typical mechanical set of rules that most people use to trade the London open. I have not personally tested this strategy (because the London open is at an inconvenient time for me due to my nature of job), but I went through the modules and it definitely seems very profitable. Good for full time traders who can watch early london opensHere is what you get in this system
  20 videos (6:30 hours total)(Daily box indicator, average true range and round number indicators)• Intraday trading system.• Early morning trades (2 hours a day).• Applicable to EUR and GBP crosses.• 50 to 100 pips per trade.


The Market Flow Strategy In this module Hector teaches a number of strategies that are based on price action and support & resistance and like the 3SMA system it works on most timeframes and currency pairs and it generates trading opportunities with very good risk/reward ratiosMARKET FLOW MODULE contains 20 videos (5 hours total) (magic bar indicator, average true range and Daily Box indicator)• Intraday trading system.• Trades all around the clock.• Applicable to any currency pair.• Aims for small, quick trades.


The Part-Time TraderThe part time trader is without a doubt my most favourite strategy in the course. In this module Hector teaches how to trade well known price action strategies like pin bars and inside bars at key levels on the daily charts with exact entry and exit strategies and many live trade examples. There are many fulltime traders who use this exact strategy, so I highly recommend that you don’t skip this one. PART TIME TRADING MODULE contains 20 videos (8 hours total)• Only 20 minutes( i spend 1-2 hours so as to update this blog) a day is enough.• Perfect for traders with full-time jobs.• Relaxed and stress-free trading pace.• Profit potential (100 to 300 pips) per trade


The News trading SystemIn this module Hector teaches a unique technique for trading news releases with price action. I haven’t really tried this strategy yet, but it’s definitely an interesting system that seems to be quite profitable.NEWS TRADING MODULE-13 videos (4 hours total)• High-momentum trading.• Blend technicals and fundamentals.• Exploit the news extra volatility,Ultra-fast trades                                                                                                    MONEY MANAGEMENT SCIENCE MODULE                                                 13 videos (5 hours total)• Correlation indicator.• Money Management indicator.• Sequential Exits indicator.• Shows you how to systematically protect your trading capital from being wiped out.


ADVANCE FOREX INDICATORS MODULE• Trend Scanner Indicator (shows currency pairs that are trending in real time.)• Forex Currency Index Indicator (shows currencies gaining or loosing strength across the board and how strongly so.)• Tutorial video on how to install them.• Tutorial video on how to trade with them.• These Indicators alone can be used to make a steady income stream over time.  In addition, a set of advanced indicators that are unlike anything I’ve ever seen before. You can definitely trade without any of these custom indicators, but the forex currency index and trend scanner indicators can be really helpful when you are looking for extra confirmations before entering trades.The benefit you will derive from this trading course is a sound understanding of how the market works. You will have all you need to make sound trading decisions that will ensure that you are trading successfully for years to come.All Indicators Are Real Time Indicators: They are not lagging indicators
 
The training program is valued at $497 which is about N80, 000 or more please, (CHECK: http://www.learnforexlive.com/store.php) but i am giving it away for just 8,000 naira only for a very limited time.


Send a message of interest to 08134820569 or call between 7-10 p.m anyday and I will send it to you via any transport company close to you in Nigeria..( This offer is only for Nigerians) 


EurUsd sell signal

This pair rose from 1.3500 last week and having seen a worse NFP data, I was expecting this pair will thrive to 1.3700
A pin bar was formed on Tuesday altering the full bullish move. This pin was confirmed yesterday by a full bearish candle


I will sell on pending order @ 1.3615 and put my stop loss @ few pips above the high of the pin and target 1.3510

Wednesday, February 12, 2014

Will the bears take over Audchf?

I discussed a pin bar forming on a falling counter trendline which has been re-established and I percieved strong . I took the trade and my first profit target was hit on 50% of my account, I reduced my stop loss to 50% and the other 50% of my account was hit giving me a little profit of 31pips in total. 


Price has since moved up and broke the pin bar to retest the falling trendline I discussed. A doji was formed today and I will wait till tommorow expecting a good bearish candle to confirm before locating a good level to sell. If price broke the trendline upward with a full bullish candle, I will have to come back another day

EurAud mid-week Review

The trade I took last week due to a clear bullish pin formed at 1.5035 support was closed on monday with a profit of 125 pips due to a percieved clear pin formed at a tiny critical point that needs an eagle eye to view. 

So the market didn't reach my profit level at 1.5450. I didn't take a sell because of the ECB president speech that was to be delivered today and given the fact that the level wasn't that signifant to my eyes.


 I just saw it as an opportunity to exit a winning trade. We will see how this market reacts at the present level, whether it's going to break it or continue the upward trend 

The level now is very critical, I will watch out


Audusd forming a DOJI @ a critical level

In my previous post on this pair, I recognised 0.9100 and thereabout as my trading level.

In the past 3 days, this pair has continued its retracement from 24th January low and a bearish movement is imminent


With a DOJI formed today a little below 0.9100, the bears might be gathering momentum to push the market down. I will wait for a full bearish candle to form at the end of tommorow close.


If that should happen, I will sell and hope I can make a good return at 0.8845 and 0.8710 and if otherwise, I will simply wait if a breakout will happen or price simply wants to touch 0.9100


I will keep you updated tomorrow...

Sunday, February 9, 2014

EurAud weekly outlook...10th-14th February 2014

A pin bar was formed at a strong support region (1.5055) and I opened a buy order. I was making 95 pips before the close of market last week


I expect this market at 1.5450 this week or early next week
If the market reverses downward and breaks the 1.5055 support then we'll be looking at 1.4540.


This pair has been bullish since November 2013.
I will keep you updated as the market unfolds itself in the coming trading days.

AudUsd weekly outlook...10th-14th February, 2014

This pair has been in a down trend from October 2013, reversed to form a strong resistance at 0.9100
With a worse than expected non-farm payroll data released from US last week, I expext this pair to move to 0.9100 which was formed by a horizontal resistance line and a counter trendline.
I will expect price action bounce around this level before the bearish trend will continue
Conversely, if 0.9100 is broken to the upside, I will wait for a reversal price action signal to push to 0.9300
In the main time, I will make 0.9100 my trading point


USDCHF Weekly Outlook 10th-14th February 2014

This pair, after the pin bar-orchestrated bear move from 0.9135, reversed upside to test 0.9135.
0.9135 wasn't reached due to the bearish engulfing candles pattern formed and the market ended last week on a bearish mood strenghtened by a worse than expected non-farm payroll data
This pair could bounce off the 0.8850 support level ( combination of trendline and horizontal support).


I will watch price action at 0.8850 if the market gets there
Otherwise, if the market turns upside, I will watch for price action at 0.9135 resistance which is made stronger by negative slope trendline
KEY LEVELS TO WATCH OUT FOR
Resistance Level          0.9130                                                                              
Support Level             0.8850

I will keep you updated as this market unfolds in the course of the week

EURUSD Weekly Analysis: 10th to 14th Feb 2014

After making 150 pips from this pair last week due to a candles reversal pattern formed around the 1.3700 where we saw a movement to 1.3500 support level.
 A reversal inside bar was formed after the market broke the trendline support (which was made stronger by the support formed earlier last week), and we see this pair immediately moved up, helped by a worse than expected non-farm payroll data released from the United states on Friday.


1.3700 is the next level to target where we could see a bounce to sell or a breakout toward 1.3830 resistance.


LEVELS TO WACTH OUT FOR

Support levels___________           1.3480 and 1.3320
Resistance Levels____________ 1.3700 and 1.3830

I will keep you updated as the trade unfolds

Thursday, February 6, 2014

AUDCHF sell signal

This pair reversing upward after a sharp movement from 0.8197 to 0.7722, could resume downward bearish trend that started from 0.8730
The resumption of the bears is based on the daily pin bar about to be formed at 0.8120-0.8197 resistance region which also coincides with the bearish trenline that started on october 2013


If this pin bar is successfully formed at the end of the trading day and it's not far away from 0.8700, I will sell at market price with my stop loss slighly above today's high ( i.e the high of the pin bar) and take profits at 0.7900 and 0.7750
If you are following this trade , please maintain proper money management

Related Posts Plugin for WordPress, Blogger...